|
SETMA’s “commitment to transparency” is demonstrated by:
- Our Clinic’s “Treatment Plans and Plans of Care,” which detail each patient’s personal care and the provider’s fulfillment of national standards of care in their treatment.
- Published newspaper articles with specifics of provider performance by provider name.
- The Public Reporting Section on SETMA’s website where over 200 quality metrics are publicly reported by provider name.
- SETMA’s participation in PQRS and in Bridges To Excellence quality reporting.
SETMA’s first step toward transparency with our patients began in 1999 when we published the “Diabetes Standard of Care,” which was included on each patient’s Diabetes Follow-up Care Note. It was described as, “This is your healthcare provider’s ‘Report Card,’ if your provider is not completing these evaluations during your visit; ask him/her to do so.” Subsequently, the disease management tools for diabetes, hypertension, hypercholesterolemia and other conditions, included the compliance standards for each condition and the patient’s adherence to the standards. This was noted as the responsibility of the patient/provider alliance in maintaining quality of care.
The first Quality Metric sets SETMA learned were published by the Physician Consortium for Performance Improvement (PCPI). In 2004, SETMA deployed the PCPI Diabetes Measures Set, so that each provider could measure their own performance at the point-of-care. The provider’s performance on these metrics was given to the patient on their Follow-up Note for each disease management tool. In February, 2009, when SETMA began learning about Patient-Centered Medical Home, we added a number of quality metric sets to our performance standards. We created a PC-MH Coordination Review template on which we deployed all of the quality metric sets which applied to the patient being treated. These included NQF, HEDIS, PCPI Diabetes, PCPI Hypertension, PCPI CHF, and PCPI Chronic Stable Angina, BTE and PQRS.
In 2010, the following NQF measures were added to our tracking and auditing: Comprehensive Diabetes Measures, General Health Measures, Medication Measures, Chronic Condition Measures, and Care for Older Adults, Female Specific Measures, and Pediatric Measures. In all more than 40, NQF measures are tracked. SETMA began tracking metrics for the Physician Quality Reporting Initiative (PQRI now PQRS). Our reporting included the following Measures Groups: Diabetes, Fall Risk, Back Pain, Preventive, and Chronic Kidney Disease. There are approximately 30 individual metrics in this reporting. Because no nationally endorsed quality measure sets exist, SETMA developed measurement sets for Stage 1-3 Chronic Renal Disease and for Lipids.
Transparency: Public Reporting SETMA Providers’ Performance on Quality Metrics
In that NCQA PC-MH Tier III recognition required that a practice report at least ten NQF-endorsed quality metrics to an external group, SETMA decided not only to report the metrics to an HMO with which SETMA works, but also to report them to our patients. We report them in several ways:
First, the PC-MH Coordination Review document, which is given to our patients at clinic visits, summarizes the current status of the care required by over 200 quality metrics. The note concludes with the following statements: “Please review this document. Identify the information which is missing from your chart, such as medical power-of-attorney, living will, etc. Please bring that with you to your next visit, e-mail your provider via our secure web portal with the information, or call your health care provider and give him/her this information…Also, please review the quality measures listed. If any apply to you and are NOT completed, please ask your provider to address these issues the next time you come to the office.”
Second, health education pieces in the newspaper with provider-specific performance metrics. For the past fifteen years, SETMA has written a weekly health column for a local newspaper. (All articles can be found under Your Life Your Health) The articles average 2,000 words each and include information about healthcare policy, transformation, and detail SETMA’s progress in improving healthcare. The articles often included SETMA’s providers’ quality performance. The following are examples of this transparency. In 2008, SETMA published the following information in an article about diabetes care. The following data was for SETMA’s HbA1C for 2008.
|
|
|
|
|
|
|
|
|
|
Patients with Diabetes Only |
|
|
|
|
All Patients |
|
Provider |
Instances |
Average
(Mean) |
Std Dev |
Median |
Mode |
Latest Value
Average
(Mean) |
Average
(Mean) |
|
Ahmed |
2611 |
7.36 |
1.9081 |
6.8 |
6 |
7.25 |
7.36 |
|
Anthony |
1912 |
6.87 |
1.4698 |
6.5 |
5.8 |
6.72 |
6.88 |
|
Anwar |
3086 |
7.31 |
1.83 |
6.8 |
6.2 |
6.92 |
7.29 |
|
Aziz |
1772 |
7.41 |
1.7623 |
6.9 |
6.9 |
7.29 |
7.36 |
|
Cricchio |
18 |
6.97 |
2.0353 |
6.1 |
5.6 |
7.05 |
6.79 |
|
Curry |
42 |
7.05 |
2.3711 |
6 |
6 |
6.76 |
6.92 |
|
Duncan |
1860 |
7.08 |
1.5776 |
6.6 |
6.4 |
6.71 |
7.02 |
|
Fowler |
1281 |
6.34 |
0.0495 |
6.3 |
6.3 |
6.03 |
6.12 |
|
Halbert |
2491 |
6.98 |
1.654 |
6.5 |
6 |
6.8 |
6.85 |
|
Henderson |
1099 |
6.91 |
1.6533 |
6.4 |
6.2 |
6.8 |
6.85 |
|
Holly |
1701 |
6.99 |
1.6471 |
6.5 |
6.2 |
6.71 |
6.89 |
|
Leifeste |
533 |
6.44 |
1.2941 |
6.1 |
5.7 |
6.41 |
6.33 |
|
McClure |
1042 |
6.36 |
1.0143 |
6.1 |
5.6 |
6.21 |
6.36 |
|
Murphy |
1388 |
6.67 |
1.5915 |
6.2 |
5.8 |
6.67 |
6.6 |
|
Satterwhite |
41 |
7.14 |
2.3175 |
6.2 |
5.6 |
6.67 |
7.12 |
|
Sims |
60 |
6.87 |
1.8085 |
6.3 |
5.5 |
6.66 |
6.84 |
|
Vardiman |
1195 |
6.94 |
1.457 |
6.6 |
6.2 |
6.58 |
6.76 |
|
Wheeler |
1173 |
6.9 |
1.7408 |
6.5 |
6.2 |
6.68 |
6.79 |
|
Wilson |
2092 |
6.97 |
1.4146 |
6.6 |
6.3 |
6.92 |
6.91 |
|
Young |
124 |
6.55 |
1.2147 |
6.2 |
6 |
6.51 |
6.2 |
|
Overall |
25521 |
6.99 |
1.6496 |
6.5 |
6 |
6.78 |
|
SETMA is a multi-ethnic, multi-cultural, multi-faith practice. This is true of the partners, the providers, the patients, and the management of SETMA. As a result, we are particularly sensitive to disparities in access to care, or in the outcomes of care for any group. There is no place this is truer than in the case of ethnicity. While nationally significant disparities of care are reported between various racial groups, SETMA has worked hard to eliminate such disparities. In a May 13, 2009 article, SETMA’s efforts to eliminate Ethnic Disparities of care in diabetes were detailed. The following were SETMA’s results comparing Caucasian patients with African-American Patients for 2009:
|
Controlled
Caucasian |
Controlled
African American |
Uncontrolled
Caucasian |
Uncontrolled
African American |
Average HbA1c |
5.76% |
5.82% |
7.48% |
8.71% |
Std Dev |
0.377 |
0.376 |
2.234 |
2.427 |
Mode |
5.80% |
5.70% |
7.70% |
7.30% |
Median |
5.80% |
5.80% |
7.70% |
7.80% |
|
Controlled |
Uncontrolled |
Caucasian |
69% |
31% |
African- American |
59% |
41% |
The above data was for all Caucasians (4104 discrete individuals) and all African Americans (2134 discrete individuals) with the diagnosis of diabetes seen by SETMA during 2009. The standard deviations, mode and median for both groups were essentially identical with the African-American group having a lower mode in the uncontrolled population and also having a lower standard deviation and mode in the controlled groups.
The only discrepancy was between the average (mean) between uncontrolled Caucasians and uncontrolled African-Americans. Rather than lament this, SETMA designed an aggressive plan for intervening in the care of the 31% of Caucasians and the 41% of African-Americans who were not controlled. Our goal was to:
- decrease the number and percentage of uncontrolled in both groups,
- decrease the standard deviations in both groups which will mean that a lower percentage of our patients will have poor diabetes control, and
- eliminate the differences between the average (mean) between the two groups and to eliminate the difference between the percentage of uncontrolled in the two groups
In 2010, we successfully eliminated ethnic disparities in care for patients with diabetes.
The following provider-specific performance data was published in a March 13, 2010 article. The statistical analysis of SETMA's HbA1C data for the period March 2009 through March 2010 shows the following provider specific information.
Third, in 2009, SETMA realized that our reporting was too involved and that the display of our reports was not easily understandable. Therefore, we undertook what we referred to as SETMA’s COGNOS Project. With the help of a consultant firm, we designed reporting modules which allowed the efficient, frequent and accurate analysis of our performance on all of the quality metrics listed above. By comparing the details of the patients treated to goal and those who weren’t, we have been able to look for leverage points for care improvement.
In a major project to identify opportunities for decreasing preventable readmissions to the hospital through BI analytics, we discovered that the most consistent issue, once care transitions issues were resolved, was how quickly the patient was seen after discharge from the hospital. Decreasing that time and increasing contact with the patient and family has resulted in a 22% decrease in preventable readmissions.
With SETMA’s COGNOS Reports, we are now able to understand the processes and outcomes of the care we deliver to all of our patients and to compare those processes and outcomes by ethnic groups, gender groups, socio-economic groups and others. COGNOS will allow SETMA to continue to move healthcare delivery forward and to improve the care for our patients.
|
Average |
Std Dev |
Median |
Mode |
Count |
Ahmed |
7.4 |
1.6 |
7 |
6.7 |
2121 |
Anthony |
6.87 |
1.55 |
6.4 |
5.9 |
407 |
Anwar |
6.7 |
1.24 |
6.4 |
6.1 |
652 |
Aziz |
6.95 |
1.68 |
6.5 |
6.4 |
285 |
Cricchio |
6.38 |
1.19 |
6.1 |
5.9 |
369 |
Curry |
7.12 |
1.77 |
6.6 |
6.1 |
185 |
Duncan |
6.63 |
1.45 |
6.2 |
5.8 |
277 |
Groff |
7.22 |
1.45 |
6.9 |
6.2 |
31 |
Halbert |
6.79 |
1.75 |
6.3 |
5.9 |
616 |
Henderson |
6.72 |
1.5 |
6.2 |
5.9 |
269 |
Holly |
6.47 |
1.38 |
6.1 |
5.9 |
542 |
Horn |
6.67 |
1.36 |
6.3 |
5.8 |
300 |
Leifeste |
6.56 |
1.47 |
6.2 |
5.9 |
638 |
Murphy |
6.51 |
1.21 |
6.2 |
6 |
900 |
Satterwhite |
6.94 |
1.61 |
6.4 |
6.1 |
169 |
Thomas |
6.48 |
1.47 |
6.1 |
5.8 |
343 |
Vardiman |
6.74 |
1.7 |
6.4 |
6.5 |
155 |
Wheeler |
6.54 |
1.23 |
6.2 |
5.9 |
288 |
Young |
6.68 |
1.65 |
6.2 |
5.7 |
144 |
SETMA |
6.82 |
1.52 |
6.4 |
5.9 |
8935 |
Public Reporting Goals
First, we wanted to know what we were doing. Without auditing our performance, we could never know how we were performing. The COGNOS Project allowed us to objectify our performance. We no longer would just "think" we were doing well; we could know if we were.
Second, we wanted to improve what we were doing. Evidence-based medicine with the treatment targets established by science, tells us where we want to be. If we know where we are and if we know where we want to go, we can design a way to get there.
Third, when we knew that a patient was not treated to goal, we wanted to know why. COGNOS allowed us to know if evidence-based standards of care were being employed. If they were, and if the patients were still not to goal, it allowed us to address obstacles to the patient getting to goal.
Fourth, we wanted to change provider behavior. The medical literature is replete with reports of "clinical inertia." Change requires that there be more discomfort in staying the same as is required to make a change. SETMA believed that comparing provider performance and publishing that performance internally by patient name, and externally as an aggregate practice performance by provider name but without the patient identifier would motivate providers to change. The data given above shows that this is true.
Fifth, we wanted to change patient behavior. Like the frog dropped into a kettle of cool water which is then placed on the fire, changes in a patient's health are often so subtle and so slow that devastation overtakes them before they realize they are sick. SETMA expanded the use of patient data through the COGNOS Project to create discomfort in patients to make them "jump out of the heating kettle" of deteriorating health before it is too late. Sixth, we wanted to examine through statistical methodology and epidemiologic-principles patterns of care and outcomes. We wanted to be able to ask questions and analyze our data to get answers both retrospectively and then prospectively to those questions.
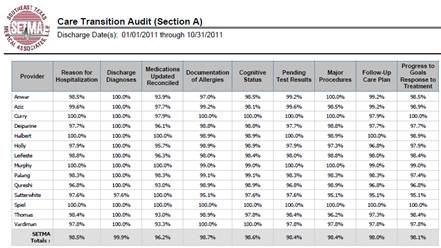
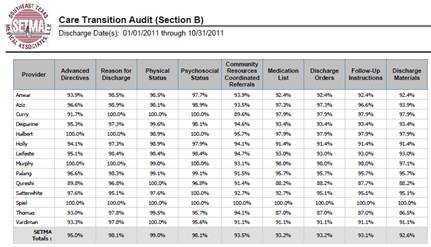
Care Transitions
SETMA has used EHR for completion of Hospital History and Physical Examinations since 2000. In 2002, we began using the EHR for completing Hospital Discharge Summaries. During an NQF Conference on Care Transitions In September 2010, SETMA changed the name of the “discharge summary” to “Hospital Care Summary and Post Hospital Plan of Care and Treatment Plan.” While long, this name is functional and addresses the imperatives of transitions of care which are critical for patient safety and for excellence of care. In June, 2009, SETMA adopted the PCPI Care Transitions Audit as a standard of care. Since then, SETMA has discharged 25,456 patients from the hospital with a 99.1% efficiency of giving the patients the Post Hospital Plan of Care and Treatment Plan with reconciled medication lists, follow-up appointments scheduled and a Care Coordination follow-up telephone call scheduled the following day. This call is a 12-30 minute call which is the first step in care coaching for the patient and is a third point of medication reconciliation.
SETMA’s care transition is not considered complete until the patient is seen by the primary care provider at which time a fourth medication reconciliation is completed. SETMA providers, in collaboration with SETMA’s Hospital Care team and SETMA’s Department of Care Coordination, work together to make sure that all issues of quality care, patient safety and follow-up care are completed. The complexity of care transitions is seen in the realization that there are eight different places a patient can go when being discharged from the inpatient setting. Each of these is discussed in articles found under Your Life Your Health at the icons Care Coordination and Care Transitions.
The following COGNOS audits, which are publicly reported, reflect SETMA’s provider performance on care transition metrics.
|