|
Explanatory Note
Introduction - PC-MH
Definition: Activation
Definition: Engagement
Definition: Shared-Decision Making
Employing the Elements of PC-MH in a Unique Patient Encounter
Insulin Resistance and Progression to Type 2 Diabetes
Life Style Interventions
What is the Cardiometabolic Risk Syndrome
What Does Insulin Do in the Body?
Does a patient have the Cardiometabolic Risk Syndrome
Review of this patient’s laboratory Data
What we learned from the laboratory tests and what should the patient do?
Renal Disease Evaluation
Determining the stage of renal disease, if any
Framingham Cardiovascular Risk Assessment
What we learned from the Framingham Risk Scores and what should the patient do?
Global Cardiovascular Risk Calculator
Lipid Management
What we learned from the lipid management tool and what should the patient do?
The Less Initiative and what should the patient do?
How to Change your BMR?
Exercise and your health
SETMA’s Weight management program
Principles of Weight Loss
Glycemic Index (GI)
The GI of Foods That Make the Largest Contribution to Carbohydrate Intake
The Health and Benefits of Low-Glycemic Food Choices
The Glycemic Index and the Cardiometabolic Risk Syndrome
The Glycemic Index in Practice
The Good-Better-Best Carbohydrates
Glycemic Load
Glycemic Load of common foods
Good rules for Glycemic Load
Our Goals and Follow-up
This document began as a summary to a specific patient as is explained in the Introduction below. In addition, it is being prepared as an example to the two Senior Medical Students from the University of Texas Health Science Center at San Antonio School of Medicine (UTHSCSA) who were participating in a Senior Medical Student Selective in Patient-Centered Medical Home. In addition, because of this patient’s personal sophistication in information technology and because his care illustrates many elements of PC-MH, this document morphed into an excellent example of how electronic health records (EHR), used in the practice of electronic patient management (EPM), can produce an analysis of a patient’s health status and how EHR and EPM can design a plan of care and a treatment plan for a complex patient. The EPM tools which SETMA uses (all of which are displayed at www.jameslhollymd.com under EPM Tools) allows us to break the patient’s healthcare needs down into pieces, but then compile those pieces into a cohesive and integrated, global plan for the patient’s care.
This document would not be appropriate for every patient but the process of its development is appropriate for all patients. And, because this document is going to be used as an example to future medical students and residents who spend time at SETMA, it has been prepared anonymously so as to be HIPAA compliant. The specific instructions to our patients can be found in red on pages: 10, 15, 18, 19.
Increasingly, practices involved in PC-MH understand that:
- Patient “activation” and
- “Engagement,” with a
- “Personal plan of care and treatment plan”, resulting from a
- “Patient-centered conversation” with the patient, which involves
- “Shared-decision making,”
are critical to the success of the PC-MH model of care. These concepts were discussed in the February 2013 Health Affairs journal, a summary of which was published in SETMA’s weekly newspaper health column which can be reviewed at the following link: Patient Activation and Engagement
Remember, this plan of care and treatment was prepared for a real patient, who was initially seen in a routine clinic visit in December, 2013, with a follow-up meeting in my office. Jerry Abraham and Laura Teveni, both Senior Medical Students at the UTHSCSA, who were engaged in a Senior Student PC-MH Selective at SETMA were present at both visits. The patient’s name and identification are not included so that this summary can be shared with others without disclosing Personal Health Information. The goal of both meetings was to “activate” and to “engage” the patient through “shared decision making,” which resulted in mutual goal setting and a plan of action for health improvement.
- Believing the patient role is important.
- Patients having the confidence and knowledge necessary to take action.
- Patients actually taking action to maintain and improve their health.
- Patients staying the course even under stress.
According to Health Affairs, “Patient activation refers to a patient’s knowledge, skills, ability and willingness to manage his or her own care.” In 2008, the Institute for Healthcare Improvement defined the “Triple Aim,” two of which elements are “improved healthcare outcomes” and “decreasing the cost of care”. A growing body of evidence demonstrates that patients who are actively involved in their health care, experience better health outcomes and incur lower costs.
Engagement is a broader concept that combines activation with interventions designed to increase activation and to promote positive patient behavior, such as obtaining preventive care or exercising regularly. “Activation” is the preparation or empowerment to obtain excellent healthcare, whereas “engagement” occurs when the patient actually participates in their care and seeks the needed care until it is obtained. “Activation” involves learning and knowledge; “engagement” involves action and application.
The concept of patient’s participating in decision making about the course and content of their own health care is alien to traditional medicine, as historically practitioners diagnosed and prescribed a treatment program, and patients were expected to comply with the practitioners’ plan. Even the vocabulary of care has changed. “Compliance” was once the judgment of whether patients followed practitioners’ instructions. Today, “adherence” is the measure of patient activation and engagement. The former term is authoritarian; the latter is collaborative, participatory and reflective of the patient’s following a care plan to which the patient has agreed. In a recent webinar, it was stated that healthcare providers are the “healer.” In PC-MH, it would be more accurate to identify the patient as the “healer,” and/or to label the patient and the provider together, working as a team, as “the healer.”
Shared-Decision Making is the first level of engagement, i.e., “patients and providers together considering the patient's condition, treatment options, the medical evidence behind the treatment options, the benefits and risks of treatment, and patients‘ preferences, and then arrive at and execute a treatment plan.” According to Health Affairs, shared-decision making involves several essential elements:
- First, providers and patients must recognize that a decision is required.
- Next, they must have at their disposal, and understand, the best available evidence.
- Finally, they must incorporate the patient's preferences into treatment decisions.
The details in this plan of care are appropriate because of the depth of background this patient has with Information Technology. In addition, part of activation and engagement is understanding and knowledge. If we want a patient to be an effective participant in shared-decision making, the patient must have a fund of knowledge. I remember, Dr. Joslin’s famous quote, “The person who knows the most about diabetes will live the longest.”
While this patient already has diabetes, the knowledge of the underlying pathology which leads to diabetes will help him know how to care for himself and the foundation of that knowledge is for him to know that he has Insulin Resistance.
Even though this patient already has diabetes, understanding the progress to Type 2 diabetes will help him follow his own treatment program to either mitigate the adverse effects of the illness, or to possibly even reverse the process. The progression from normal glucose tolerance to Type 2 diabetes is characterized by two defects that include insulin resistance (a condition where the body does not respond normally to insulin) and an insulin secretory defect (where the body cannot produce enough insulin) caused by beta-cell dysfunction (these cells produce insulin in the pancreas as they are said to be dysfunctional when they cannot produce enough insulin to maintain normal blood glucose levels).
Insulin resistance is characterized by decreased tissue (muscle and liver) sensitivity to insulin. In this case, the pancreas and its beta cells produce more and more insulin which results in hyperinsulinemia (increased insulin - “hyper.” Elevated; “insulin;” “-nemia,” in the blood). In the progression to diabetes, initially, plasma (blood without the red blood cells) glucose levels are maintained in the normal range by this increased insulin production. Then in patients who will eventually develop diabetes, there is a decline in beta-cell secretory capacity. This happens because beta cells “get tired” and cannot keep up with the insulin demands and because the elevated blood sugar destroys beta cells which decreases the pancreas’ ability to maintain the increased insulin production.
The first glucose abnormality that is detected is a rise in the postprandial (after meals) glucose levels because of reduced first-phase insulin secretion (the insulin rise in response to a meal or ingestion of food). With time, further decline in beta-cell function leads to elevation of the fasting glucose levels which is called Impaired Fasting Glucose (IFG, a fasting blood glucose above 100 mg/dl). Eventually, diabetes occurs, with more insulin secretory loss. The following diagram shows these steps.
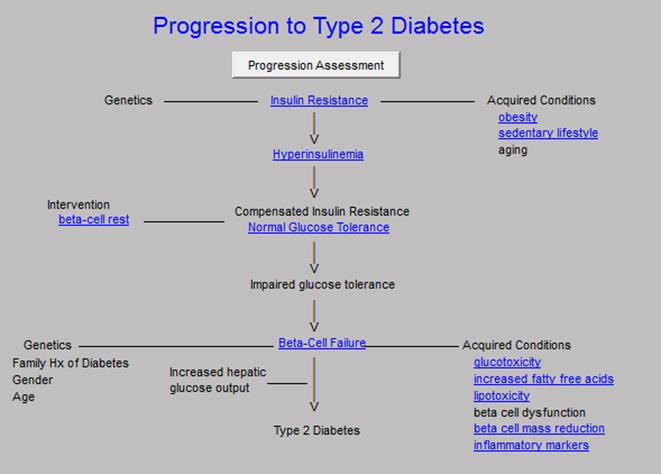
Click Links in Image for More Information
Studies of patients with Impaired Glucose Tolerance (IGT, which is the step before the patient experiences overt diabetes) have shown success for lifestyle interventions in delaying or preventing the development of diabetes. There is strong evidence that a structured program of diet and exercise can reduce the risk of progression to Type 2 diabetes in patients with IGT. Patients with IFG, which is the step before the development of IGT, which is the step before a patient develops frank diabetes, should be advised on the benefits of modest weight loss, good dietary habits, and regular physical activity. Dr. Elliot Joslin, who founded the Joslin Diabetes Center in Boston, Massachusetts in 1895, famously said, “I am more interested in knowing how far you walked than how much you ate.” In 2010, after a nine-year friendship with the Diabetes Center of Excellence, SETMA became a formal affiliate of Joslin which is affiliated with Harvard University.
In the Diabetes Prevention Program Study (DPP), 3,234 patients with IGT and a Body Mass Index (BMI) greater than 24 kg per m2 were randomly assigned to one of the following groups: placebo, metformin (Glucophage), or intensive lifestyle modification. The lifestyle modification group was offered a 16-lesson curriculum aimed at achieving a weight loss goal of more than 7 percent of their initial body weight through a low-calorie, low-fat diet and moderate-intensity exercise for 150 minutes per week.
After an average follow-up of 2.8 years, there was a 58 percent relative risk reduction in the progression to diabetes in the lifestyle intervention group compared with the placebo group. The relative risk reduction was 31 percent in the metformin group compared with the placebo group. In this study, lifestyle intervention was effective in men and women, and in all ethnic groups. It was most beneficial in patients older than 60 years; in this group, it reduced the incidence of diabetes by about 71 percent.
The Cardiometabolic Syndrome has gone through several name changes:
- Syndrome X
- Insulin Resistance Syndrome
- Metabolic Syndrome
- Cardiometabolic Risk Syndrome
Number four is the current name of the syndrome and continuously reminds us that the complex of disorders which is part of the Cardiometabolic Risk Syndrome contribute to that our risk.
Insulin helps control the sugar that is in the blood by:
- Causing the sugar to enter the muscle cells to produce energy
- Controls the liver’s production of sugar by stopping the liver’s changing of all food into sugar when the blood sugar goes up.
When the body ignores insulin (when it is resistant to the effect of insulin), the muscles do not allow sugar into the muscle cells, and the liver keeps making sugar out of protein even when the blood sugar is high. When this happens, the pancreas works harder to produce more insulin to overcome the body’s resistance to its effect. Eventually, the cells in the pancreas which produce insulin (the Beta cells) can’t keep up with the demand. Initially, the Fasting blood sugar (IFG) is higher, then the patient develops Impaired Glucose Tolerance. Then when the blood sugar level increases to a higher level, a patient has diabetes.
SETMA evaluates whether each patient has the Cardiometabolic Risk Syndrome by three different formulas: the World Health Organization, the ATP-III and the International Diabetes Foundation. The following template is SETMA’s Cardiometabolic Risk Syndrome Assessment template. When a button is clicked the computer automatically loads all of the data from the patient’s record and in less than one second alerts the provider to whether or not the patient has this risk syndrome.
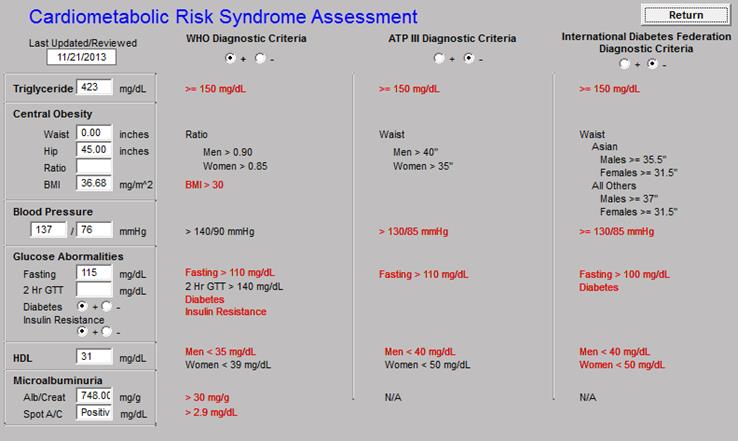
These are the elements of the Cardiometabolic Risk assessment. In this patient’s case, the WHO formula shows that this patient has the Cardiovascular Risk Syndrome. By looking at the elements in each of the risk scores, you get an idea of what places you at increased cardiovascular risk: elevated blood pressure, weight, triglycerides as a proxy for insulin resistance, and elevated glucose. Below is the Master Cardiometabolic Risk Syndrome template. While introducing an extensive series of templates through which a provider can evaluate and treat a patient with this syndrome, it lists other heart risk factors and displays the laboratory analysis which has been done with which to evaluate the risk.
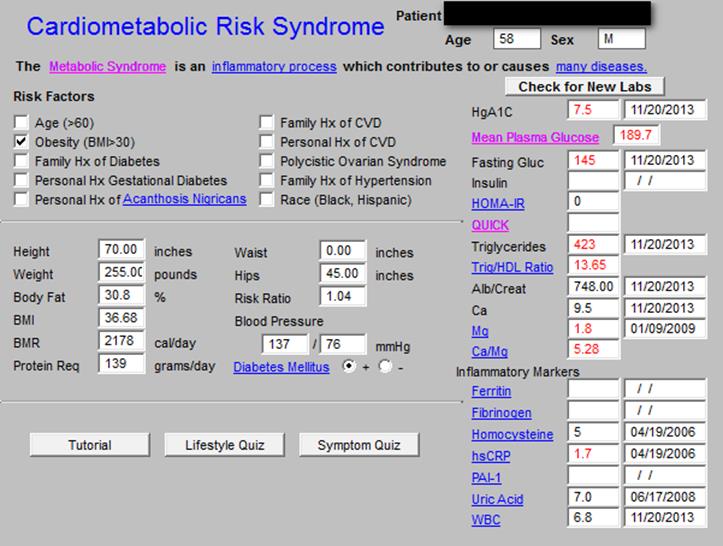
Click Links in Image for More Information
When this patient was seen in the clinic, tests were ordered from the examination room, the results were automatically sent from the lab to the patient’s records, values automatically populated this Master Template and the Cardiometabolic Risk Syndrome result was calculated automatically. The following is an explanation of the laboratory test and the values for this patient:
HgbA1c - this first number is spoken as “hemoglobin A1C.” This is a measure of the percent of the red blood cells which has sugar attached to the red blood cell. When the HgbA1c is above 6.0%, the patient is said to have pre-diabetes. When the HbgA1C is above 6.5%, the patient is diagnosed with diabetes. The goal for HgbA1C in patients with diabetes is a value below 7.0%. When the patient’s HgbA1C is above 7.0%, over time, injury is done to the eyes, kidneys, and arteries. Our team member, this patient with diabetes has a value of 7.5% which means that his diabetes is poorly controlled. Because we know that he has been non-adherent (he has not been taking his medicine regularly), one of the major elements of this visit is to get him to make a decision to take good care of himself.
Mean Plasma Glucose (MPG) - This is the calculated blood sugar level over three months based on the HgbA1C and a formula. Our patient’s MPG is 189.7 mg/dl. Because the ideal is that the mean plasma glucose is 120 or less, our patient is not doing well. If he continues neglecting his health, the consequences may be grave over a long period of time.
Fasting Glucose (FG) - This is the result of the blood sugar value which is done in the laboratory after the patient has not eaten for twelve hours. Our patient’s FG is 145 mg/dl. This value is also high and indicates that he has Impaired Glucose Tolerance which has progressed to diabetes.
Insulin - This is the measurement of the level of the insulin in the blood. When the insulin level starts getting higher, it means the patient is progressing toward diabetes. When a fasting insulin level is obtained with a fasting blood sugar other calculations can be completed which will help us track the patient’s progress toward diabetes.
HOMA-IR - This is the Homeostasis Model Assessment of Insulin Resistance. This is a calculation which is most often used in research but when the value is over 2.0, it is diagnostic of insulin resistance. In patients who are in a stage called pre-diabetes (IFG and IGT), this can be a useful test to know how far the process has gone.
QUICK -- The Quantitative Insulin-Sensitivity Check Index (QUICKI) which is also a research computation of insulin resistance. This is not commonly used in clinical practice but is included in our EMR for completeness.
Triglycerides - This is a measure of the fats in the blood and is usually higher in patients with uncontrolled diabetes and/or insulin resistance. Our patient’s value is 425 which is very high, although this is not as high as his values have been in the past. By themselves, as in Fredrickson Type 1 Classification of Dysplidemia, triglycerides do not cause heart disease and represent isolated high triglycerides. Associated with abnormal cholesterol in Type V Fredrickson Dyslipidemia, they may make a low contribution to heart disease.
Trig/HDL ratio - This may be a better marker of insulin resistance than the fasting insulin level, particularly as the ratio shows similar correlation with insulin resistance. The ratio shows a linear relationship to plasma insulin, suggesting a relationship with insulin resistance. If the value is above 2.0, then it is highly suggestive that that patient has insulin resistance. Our patient has a value which is 13.65 which is very high. Trig/HDL ratio is an inexpensive and value marker for insulin resistance.
Alb/Creatinine Ratio - The albumin/creatinine ratio is a measure of protein in the urine which is evidence of early onset of kidney disease if elevated. Our patient’s ratio is 748, which is indicative of mild proteinuria. Using one of six formulas for Estimated Glomerular Filtration Rate (GFR), SETMA uses our Chronic Renal Disease Tool to calculate that this patient has Stage 1, Chronic Renal Disease which is the earliest stage of kidney disease (see Renal Disease Evaluation, page 10). This is one of the harmful effects of not controlling the blood sugar in a patient with diabetes. We will want to take steps to prevent progression to kidney failure.
Ca (Calcium) - This is the measure of the amount of calcium in the blood. In addition to bone health, calcium promotes blood clotting. If the patient’s calcium is high, and/or if it is high in relationship to Magnesium, the patient will have a higher tendency for the blood to clot. Our patient’s calcium is 9.5 mg/dl with a normal range of 8.4-10.4 mg/dl. Calcium is address in relationship to the Cardiometabolic Resistance Syndrome because of its relationship to heart disease. If the patient has a greater tendency for his blood to clot, it could increase the risk of the syndrome.
Mg (Magnesium) - This is the measure of the magnesium in the blood. Mg contributes to the blood not clotting. Our patient’s value is 1.8 mg/dl with a normal range from 1.6-2.3 mg/dl. Often low magnesium is reflective of not eating enough green, leafy vegetables.
Ca/Mg Ratio - This ratio is reflective of the equilibrium between CA and Mg, thus the balance between clotting and not clotting. Our patient’s ratio is 5.28 which is above the desired value of 4.0 or lower. Because the blood tests for Ca and Mg were not taken at the same time, we will repeat the test in six weeks before taking steps to raise the magnesium.
- The patient’s blood sugar is not well controlled, therefore, we will continue on the Metformin and Amaryl and because he had not been on his medication for several months, we will wait for six weeks before repeating the tests to determine if we should increase the dosages of medications.
- The patient has severe insulin resistance. Again, because he has not been on his medications which will improve diabetes control and improve insulin resistance we will wait for a follow-up examination before we change medication.
- The patient has early kidney dysfunction manifested by protein in the urine and early mild decrease in GFR. ACE Inhibitors, a form of blood pressure medication, are helpful to patients with diabetes. This patient is on an ACE Inhibitor. Often, ACE inhibitors will eliminate the protein from the urine and will reverse early diabetic kidney disease. This will need to be monitored carefully.
- In a patient with diabetes, it is more important to control the blood pressure than even to control the blood sugar. Protection of the kidneys depends upon eliminating the protein in the urine, controlling the blood pressure and controlling the blood sugar. We will review these issues in six weeks with repeat blood testing.
- We will review the Ca/Mg ratio in six weeks as well.
Built on the National Kidney Foundation standards of evaluation, and on their care of chronic renal disease, SETMA’s renal disease tool allows us to calculate the Estimated Glomerular Filtration Rate, the stage, if any, of chronic renal disease, the patient’s hydration evaluation, and the protein in the urine, if any. Our patient has a positive Micral Strip for microalbuminuria and a high albumin/creatinine ratio.
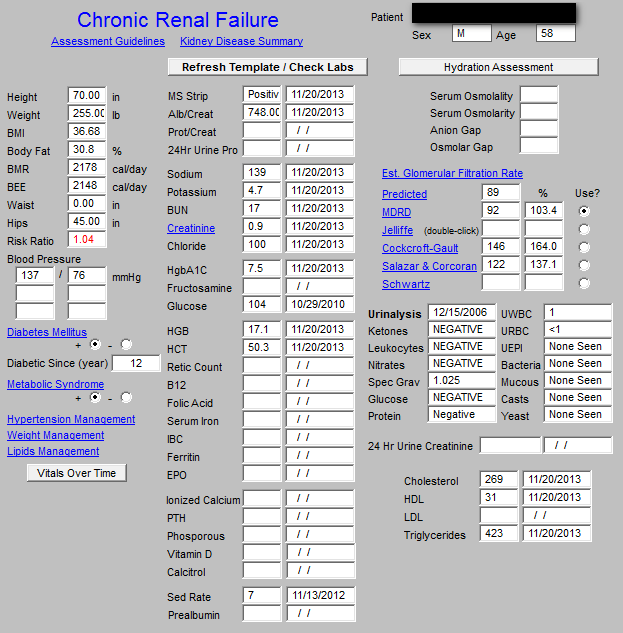
Click Links in Image for More Information
With the following tool, we are able to display the Degree of Proteinuria after the above is automatically populated into the Proteinuria template.
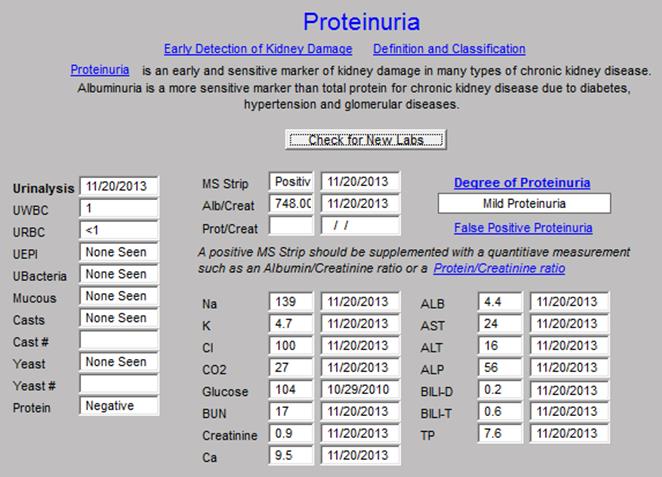
Click Links in Image for More Information
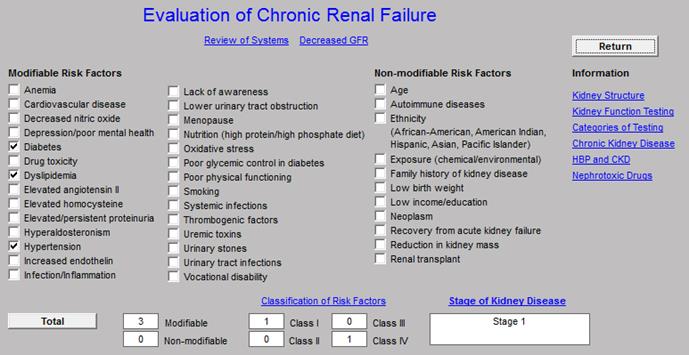
In evaluating the presence or absence of Chronic Renal Failure, the following template automatically populates the modifiable risk factors and the non-modifiable risk factors for renal disease.
Click Links in Image for More Information
The provider must note whether the patient has an evidence of renal damage. There are three:
- Protein in the urine
- Creatinine of 1.5, or above
- Renal ultrasound showing evidence of medical kidney disease
If one of these evidences of renal damage is present, the provider notes that on the template below and then clicks “calculate.” This gives an objective, verifiable means of determining whether the patient has renal disease and allowing the patient and the provider to take steps to keep it from progressing.
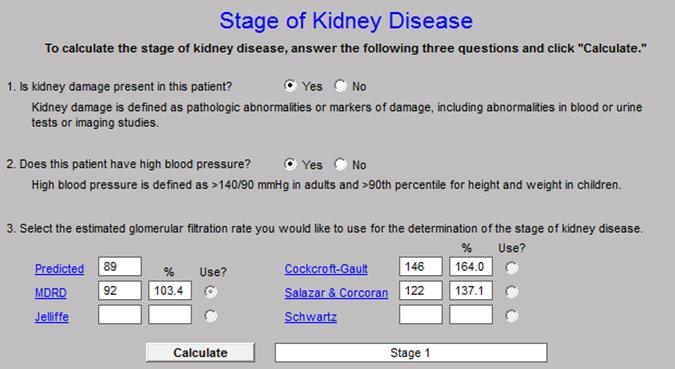
Click Links in Image for More Information
Our patient has Stage I Chronic Renal Disease. At his next visit, we will discuss how to prevent this progressing to renal failure.
The Cardiometabolic Risk Syndrome is a set of conditions which increases the patient’s risk of heart disease. Research has given us another method to measure our patient’s cardiovascular risk. In August 2010, the American Journal of Family Medicine recommended that family physicians calculate a Framingham Risk Calculator for each of their patients every five years. For years, SETMA has calculated multiple risk scores and four years ago deployed all twelve risk scores. We then added five “What If Scenarios” for each score. This means we can tell the patient their risk score at the current visit and then we can tell them what that score will become in five different scenarios. Those scenarios are: all elements are treated to goal; all elements are treated to 20% of goal; one of each of three elements treated to goal. With an original 12 scores and adding five new ones for each of the original twelve, SETMA now has 72 scores to calculate. It still takes less than one second to calculate all 72 scores. The complete explanation of the Framingham study can be found at the following link. Framingham Heart Study Risk Calculators Tutorial: History and Usefulness of the Framingham Calculators & SETMA's Innovative Use of Calculators
including SETMA's "What If Scenari"?.
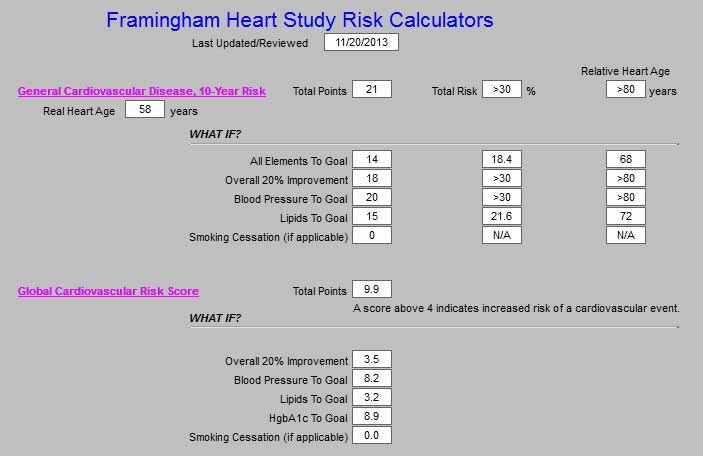
Click Links in Image for More Information
While the patient is only 59 years old, his “relative heart age” is above 80 years of age. By itself that information would just be depressing, but SETMA’s addition of the “What If Scenario” to this evaluation gives the patient hope that “if he makes a change,” it will make a difference in his future health. As is shown above, if the patient improves to goal all of the elements of the Framingham Cardiovascular Disease, 10-year Risk score, his risk drops from greater than 30% to 18% and his relative heart age drops from greater than 80 years, to 68 years of age.
In the following template from SETMA’s EHR, the elements which make up this Framingham 10-Year Risk are displayed, giving the patient guidance for how to change his life-style and condition in order to improve his cardiovascular risk.
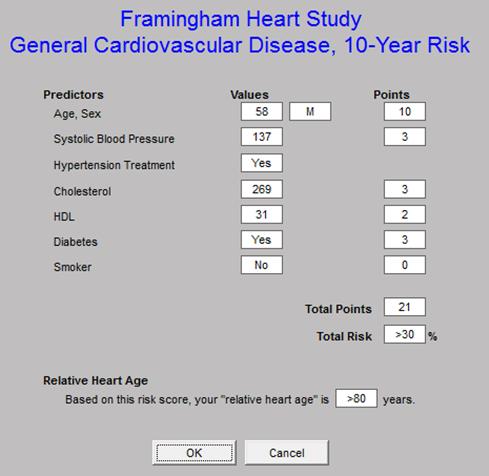
Our patient can look at the above and see that his current heart age is 58, but his “relative heart age,” due to his diabetes, heart history, etc., is over 80. In the following display, our patient can know what the elements of the General Cardiovascular Disease 10-year Risk are. In order to improve his cardiovascular risk, our patient needs to:
- Improve his systolic blood pressure. If he reduced his systolic blood pressure by 20 mm of mercury, his cardiovascular and his stroke risk would decreased significantly.
- Decrease his total cholesterol. He is on a statin but had stopped it for a while. He needs to continue on this medication faithfully. Because Statins deplete the bodies supply of an antioxidant named Co-Enzyme Q-10, he should add a supplement of Co-Q 10 to his diet in the form of a gel cap at the dose of 400 mgs per day.
- Increase his HDL (the good cholesterol) to 40 if possible. The principle way to do this is weight loss and exercise.
- Below, on the Lipid Disease Management Template, we show the Cholesterol/HDL ratio. Ideal is below 4 and the lower the better. Our patient’s value is 6.8 which is very high. This ratio can be improved by either lowering the total cholesterol or raising the HDL.
- On the Lipid Template we also see that the patient’s LDL (the bad cholesterol) is 177. We would like for that to be below 70 mg/dl. Doing that will require weight loss, dietary discretion and exercise. SETMA’s education department teaches Medical Nutrition Therapy for weight loss, renal disease and for cholesterol. That department also teaches Diabetes Self-Management Education classes. Our patient will be referred to those classes.
The second risk calculator which is important for our patient is the Global Cardiovascular Risk Calculator. This risk score is important for several reasons:
- While it is not a Framingham Score, the Global Cardiovascular Risk Calculator is a score which is based on the Framingham Data. Remember, the Framingham data was built on the HDL because in 1949 when the study started, we were not measuring LDL.
- This score eliminated two unchangeable features: age and gender. The weight of these two elements was so great in the original Framingham study that many elderly people were designated as high risk because of age when in fact they were low risk even at their age. Many young people were designated as low risk even though they were at high risk because of their youth.
- This score is the only score which uses HbA1c values as an element, the other Framingham scores simply designate whether a patient has diabetes or not. Using the HbA1c value, lets patients with diabetes who control their blood sugar see the value of their hard work.
The elements of the Global Cardiovascular Risk Score can be seen below. To the right, the “What IF Analysis” is displayed for controlling only the blood pressure. The Risk Score is 9.9 which is very high and controlling the blood pressure in this patient’s case doesn’t improve it significantly. But if you look at the template below the following one, you see the significant decrease in risk, if all are treated to goal.
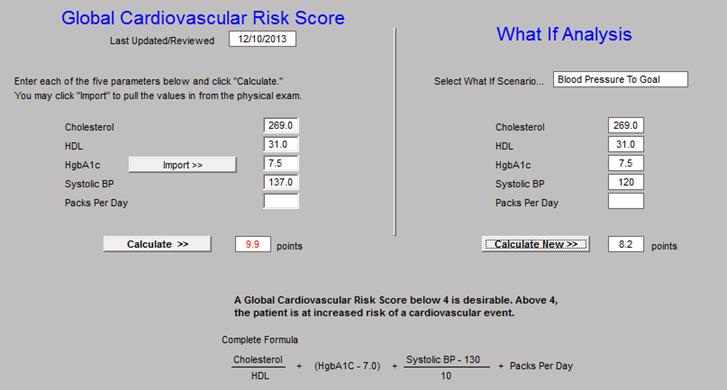
This score shows our patient that he currently has a very high cardiovascular risk. Normal risk is below 4 in this score and his is current 9.9. However in the display below, the patient learns that if he treats all of the elements top goal of the Global Cardiovascular Risk Score, his risk will drop to 3.5, a dramatic improvement.

Click Links in Image for More Information
Our patient can also learn about his risk through analyzing his cholesterol through SETMA’s Lipid Management tool.
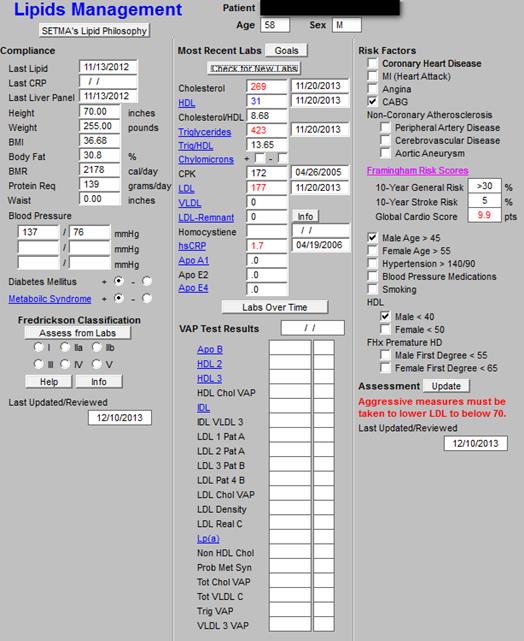
Click Links in Image for More Information
As can be seen above, the treatment algorithm indicates that with the following risk factors, our patient needs to take aggressive measures to decrease his LDL to below 70 mg/dl:
- History of Heart Disease and a Coronary Artery By-Pass Surgery
- Low HDL.
- High Total Cholesterol
- High LDL
- Male Gender
- Male over 45
We have discussed LDL, HDL, Cholesterol/HDL Ratio above. It is enough here to say that it is imperative with our present knowledge to correct these abnormalities.
The key for our patient to improve his health is to take heed to the three elements of the LESS Initiative: lose weight, exercise and stop smoking. He does not smoke, so the other two become very important.
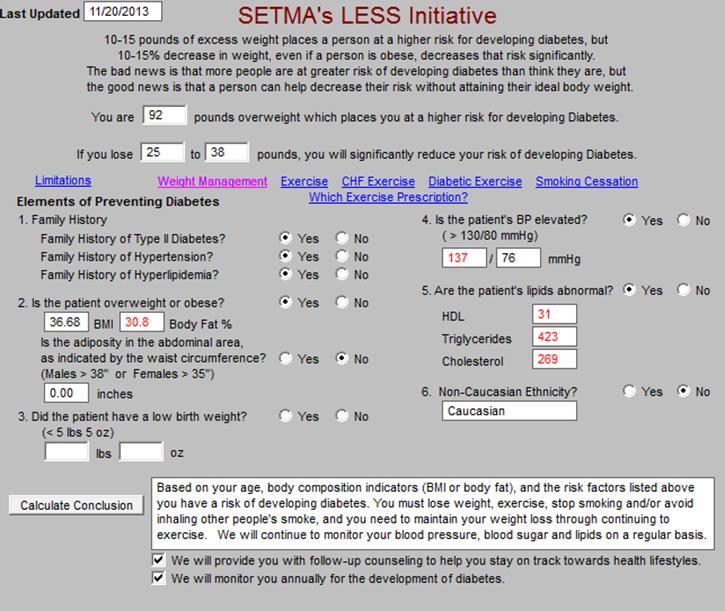
Click Links in Image for More Information
The Agency for Healthcare Research and Quality (AHRQ), which is a department of Health and Human Services (HHS), has published SETMA’s LESS Initiative on their Innovation Exchange. The complete explanation of the LESS can be found at The LESS Initiative Tutorial.
The Master LESS Initiative Template addresses the risk factors for diabetes: six for males and seven for females. Even though our patient already has diabetes, reviewing the six risk factors for a person “getting” diabetes will familiarize him with how he can improve his treatment of his having diabetes. It also reminds him to review the copy of his LESS Initiative which he received at his last visit. It includes a personalize exercise prescription and a personalized weight management tool. The weight management tool taught him his: BMI; Basal Metabolic Rate (BMR); How to change his BMR. Below we will show our patient how to change his BMR by changing his activity.
The BMR is the measure of how many calorie it takes in a day to maintain a patient’s current weight. When the nurse takes the patient’s weight and height, the BMI is calculated automatically. By adding one more element - level of activity - our patient’s BMR can be and is calculated. (see below in column one at BMR.)
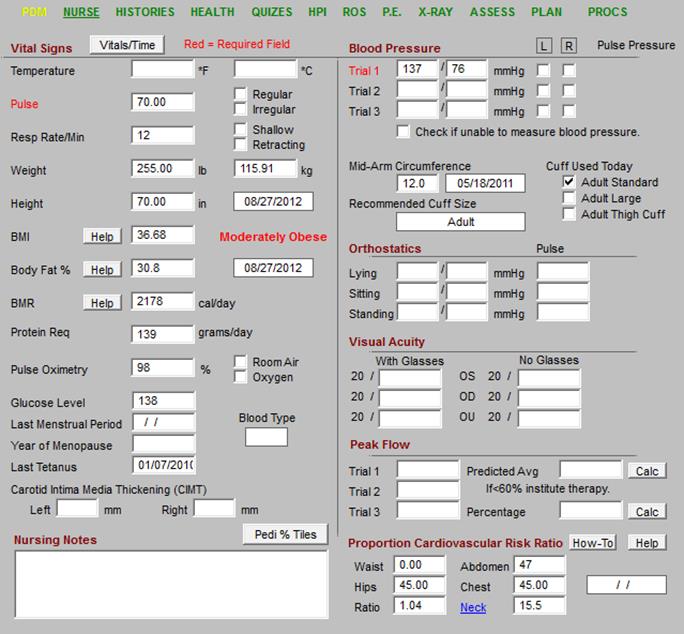
Click Links in Image for More Information
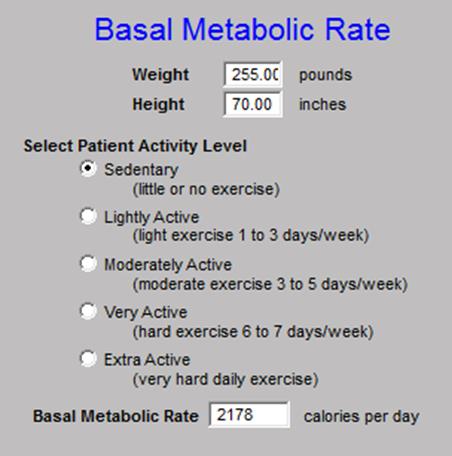
As can be seen on the Nursing Template above and at the Basal Metabolic Rate pop-up below, when the patient lives at a sedentary activity level, he requires 2178 calories a day to maintain his current body weight. There are two ways to lose weight: one is to eat less and the other is to burn more calories by increasing his activity level.
With this BMR calculation tool, it is possible to learn the impact of changes in activity. First, our patient needs to know that a pound of fat only requires 4 calories a day to maintain it. A pound of muscle requires 15 calories a day. It is easy to see why it is so hard and slow to lose weight just by decreasing intake. If a patient is 100 pounds overweight due to fat, those 100 pounds of fat only need 4 calories each or a total of 400 calories a day to maintain the fat weight. Sadly, two large apples a day can maintain 100 pounds of fat. While 100 pounds of muscle requires 1500 calories a day. To lose weight, you need to eat less and as we will discuss later, you need to eat better food.
If our patient remains at a sedentary activity life style, he needs 2178 calories a day to maintain his current weight. To lose weight, he must give up food. If he gave up 600 calories a day, and in that a pound of fat has 4,000 calories, he would lose a pound a week, i.e., 7 days times 600 calories or 4,200 a week.
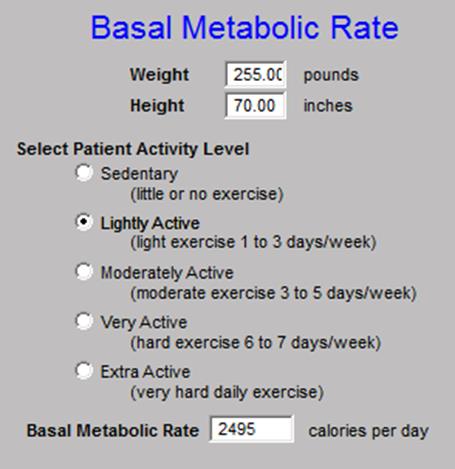
But if our patient begins to be active at a “Lightly Active” level or 1-3 days a week walking 2 miles and moving around more with activities of daily living, his BMR would go up to 2,495 calories a day. That means he would burn up 317 more calories a day or in seven days 2,205 more calories in a week. That’s another ½ pound of weight loss a week.
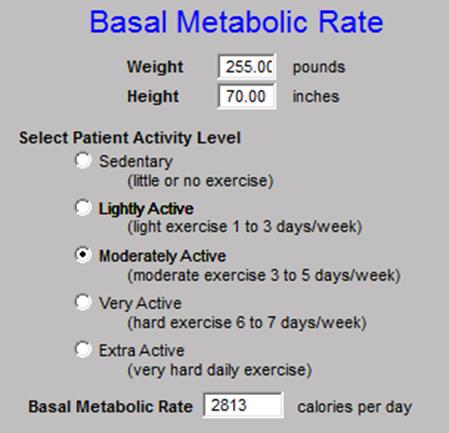
If our patient/friend increased his activity to a “moderately active” level, as in walking 3 miles 3-5 days a week, his BMR would go up to 2813 calories a day. That means from his sedentary life style, he would now consume 4,445 more calories a week. That means he would lose an additional pound a week.
While the above figures are good approximations, in reality there is a synergistic effect. When you start decreasing your intake of sugar, while bread and other nutrition poor, calorie dense foods and increasing your activity, your fundamental metabolism will change and you will “out perform” the numbers and you will lose more weight. And, as long as you continue your new lifestyle, you will maintain the weight loss.
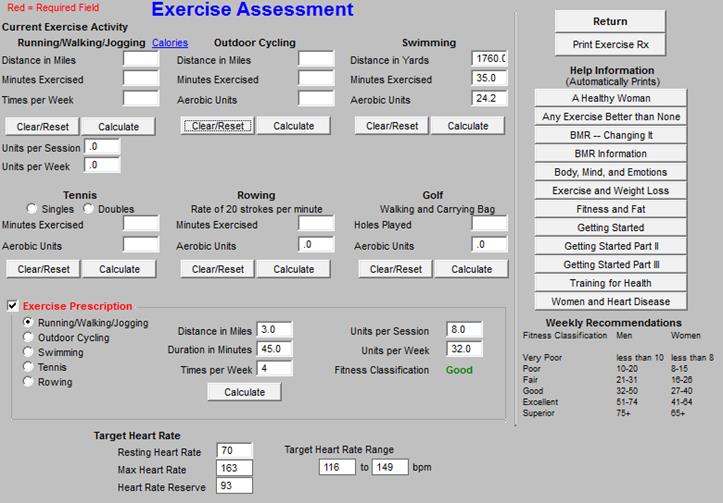
In the LESS Initiative, our patient received an exercise assessment which is built on the Aerobic Point system developed by the Cooper Clinic in Dallas. This is an excellent teaching tool as well as evaluational. If deployed it would show you that 18 holes of golf, if you carry your own clubs results in 3 aerobic units. In that you need 32 a week, you would have to play 11 rounds of 18 holes of golf for that to meet your aerobic needs. There may be other reasons to play golf but cardiovascular fitness is not one of them.
Click Links in Image for More Information
With the LESS Initiative, the patient received a fifteen page, personalized exercise prescription which will be reviewed multiple times a year.
In addition to calculating, the patient’s BMR, SETMA also completes a Weight Management Assessment for all patients seen at SETMA. This tool tells our patient that he is “Moderately Obese - Class II,’ and that his disease risk from obesity is “very high,” and that treatment for obesity should be initiated.
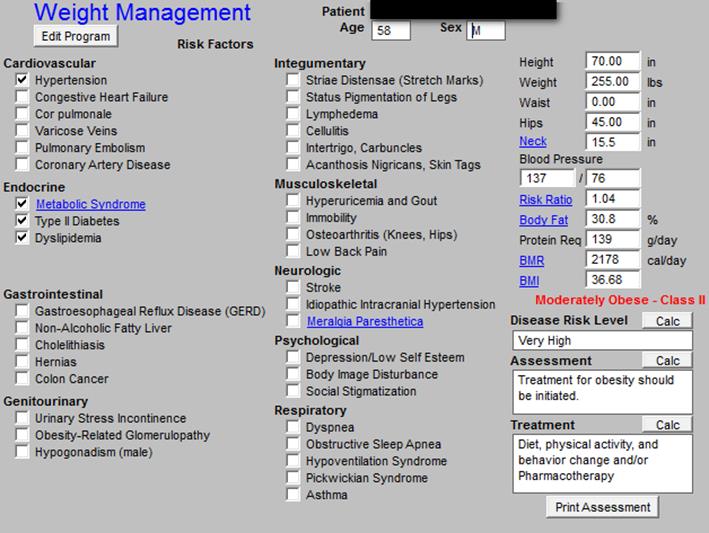
Click Links in Image for More Information
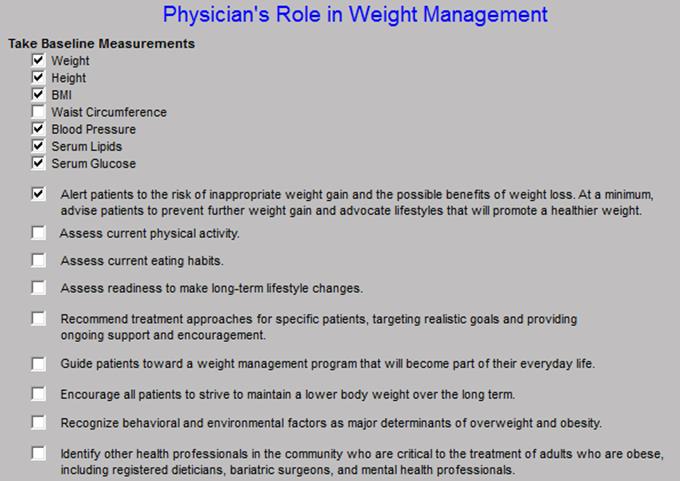
The weight management tool also identifies the healthcare provider’s responsibility for our patient/friend losing weight. It may also help for the patient to know that fat cells are not inactive but are producing dozens of substances, all of which are harmful to the body. Without the provider doing anything but treat the patient the elements of the Physician’s Role in Weight Management (see below) is completed automatically.
There are seven principles which underlie any successful weight-reduction program; they are:
- Admit that you're fat.
- No program -- absolutely none -- will be successful which does not include the self-disciplined and intentional reduction in the total caloric intake.
- Any successful weight reduction program must include a reduction in the total fat intake in the diet.
- Eat more vegetables and fruits and start eating vegetables which you don't like.
- Start a reasonable exercise program which you can and will maintain for at least ten years.
- Be a tortoise rather than a hare. Be resolved to continue for as long as it takes.
- Tell others what you are doing and invite them to hold you accountable.
Principle One -- Admit that you're fat.
To successfully lose weight and to keep the weight off, the first step is accepting that you are "fat." We often use euphemisms to soften the impact of self revelation.
- I am not "fat," I am portly!
- I am not "fat," I am corpulent!
- I am not "fat," I am plump!
- I am not "fat," I am overweight, or, as Garfield the cat says, "under tall!"
Yet, each of these mental accommodations which we make with reality simply excuse our ignoring of the health implications of "significant" obesity. If you are more than 20% overweight -- 20 pounds for a person whose ideal weight is 100 pounds and 180 pounds for someone whose ideal weight is 150 pounds -- your weight is contributing to the inefficiency of bodily functions and can produce dire health consequences. If you wake up one morning and say to your self in the mirror, "Hi, my name is _______ and I am FAT," you have taken the first step to doing something about it.
Weight Reduction Principle Number One:
The second step is to change something, however small it may seem to be. Some things require radical change. These things typically are those with a one-time fix, such as smoking cessation. The only effective way to stop smoking is to stop! "Slowing down" not only does not help your health -- a few cigarettes a day have been shown to be as bad as two packs -- but it is a sure way to fail. Weight reduction on the other hand, because it is a life-time and a life-style matter, is best done by "slowing down."
No matter what diet you chose, and there is no magical potion which will help you "melt" away the pounds, you must decrease your total caloric intake each day in order to lose weight. Fat is nothing but "stored energy!" When you consume more food than is required for your body to function; the body stores that excess energy in "fat" deposits. Some animals use these fat stores for food during long periods of fasting, such as during hibernation for bears. Human beings do not, and, indeed, cannot go for long periods of time with no food, and therefore, if you regularly and consistently eat more than you require, your fat stores will continue to accumulate.
Fat is the physical evidence that you are eating more food than you require. Now, it is possible not to "pig out" and still gain weight, if you are inactive. Successful weight reduction will usually be the result of a combination of increased output -- more exercise -- and decreased input -- eating less. And, never forget, if you are not hungry part of the day, you will not lose weight. Furthermore, if you are not willing to "work through" hunger pains, you will never successfully lose weight.
Principle Number Two: No weight reduction program -- absolutely none -- will be successful which does not include the self-disciplined and intentional reduction in the total, daily caloric intake.
Not only must there be a total decrease in the amount of food consumed on a daily basis, but there must be a change in the kinds of food you eat. Fat is one of the basic food groups and contains 9 calories per gram, while protein contains only 4. It is obvious therefore, that if you eat 10 grams of fat, you are taking in 90 calories, while if you eat 10 grams of protein, you are taking in only 40 calories. This means that you can eat twice as much protein as fat and still not gain weight. In addition, the health consequences of a high-fat diet, besides contributing to weight gain, are dire in that it contributes to hardening of the arteries as well. Remember, in the same way that fat accumulates around the waist, under the skin and in other obvious places, it also accumulates around the heart and in the liver. If you will simply reduce the amount of meat which you eat, you will begin to see improvement in your weight.
Principle Number Three: Any successful weight reduction program must include a reduction in the total fat intake in the diet.
Principle Number Four: Eat more vegetables and fruits and start eating vegetables which you don't like.
Successful weight reduction requires you to start eating things which you don't like. A diet of meat and bread may be delicious, but it is not healthy Fruits and vegetables not only have vitamins which we know we need, they contain many other healthy, naturally occurring chemicals which contribute to health in ways we don't even understand. Fruits and vegetable also contain fiber which is an essential part of controlling cholesterol and creating bowel regularity. If you are REALLY serious about losing weight and keeping it off, think about the vegetable which you absolutely can't stand. Then begin to eat it twice a day. Make sure you eat all of that food before you allow yourself to eat anything else. Several things will happen:
- You will think about what you're eating.
- You will begin liking something you previously despised.
- You will make a definite change in your eating pattern; because you will change the way you approach and think about food.
Principle Number Five: Start a reasonable exercise program which you can and will maintain for at least ten years.
Start to exercise. Remember, like your diet changes, exercise must be something which you can and will maintain for the rest of your life. It must be:
- Convenient,
- Not cause you potential injury and
- Be something you can do even as your body ages.
This means that "power lifting" is not a reasonable exercise regimen for a fifty or sixty year old to undertake. It also means that while running a marathon may be an exciting goal, it is not a life-long exercise regimen which you can maintain. Walking, biking, swimming, even jogging, are life-long exercise regimens which you can maintain over a very long period of time. Start cautiously and remember, it is not how much you do in the first week which makes the difference. It is how much you do in the next ten years that will change your health.
Principle Number six: Be a tortoise rather than a hare. Be resolved to continue for as long as it takes.
Make sure that you are not starting a program, but that you are changing your habits for life. The story of the tortoise and the hare has many applications, few more appropriate than in changing your habits for health reasons. The hare may get the initial raves and praise, but it is the tortoise who will be successful. Initial success is important for maintaining enthusiasm, but initial success which is not followed by long-term resolution will only result in frustration and failure. Repeated failure will discourage new attempts. As you change your life-style:
- Substitute fruit for fats.
- Substitute dried fruits such as raisins for candy.
- Eliminate high calorie, low food value products such as cold drinks and snack foods from your diet.
- Add foods to your diet which are good for you but which you previously avoided because of taste.
- If you eat out, eat where you can get vegetables which are not prepared with sugar and fat.
- If you eat out, avoid all-you-can-eat buffets which encourage you to overeat.
- Don't go on a three month diet; change your habits for life.
Remember, what Dr. Cooley supposedly once said, "If you put it in your mouth and it tastes good, spit it out; it's not healthy for you." While this is an exaggeration, it has some truth. As you retrain your body, you retrain your taste. Learn to like what you didn't like; learn to eat what you have avoided. If you succeed in eliminating a great deal of meat and fast foods from your diet, you will go a long way toward a life-long successful change in your weight and health.
Principle Number Seven: Tell others what you are doing and invite them to hold you accountable.
Seventh, with your family, friends and associates, talk about what you are doing. Let them help hold you accountable. The more you talk about your commitment, within reason, the more you internalize it and objectify it so that you are more likely to maintain your commitment.
The glycemic index (GI) of foods has important implications for the prevention and treatment of the major causes of morbidity and mortality in western countries, including Type 2 diabetes, coronary heart disease, and obesity. At least 55% of energy should be derived from carbohydrate and the bulk of those carbohydrate foods should be those rich in dietary fiber (non-starch polysaccharide and with a low glycemic index).
What is the GI, and why has it become so important? The GI is a method used to classify foods according to their blood glucose-raising potential. It compares the level of glycemia (blood sugar) after equal carbohydrate portions of foods and ranks them relative to a standard (usually glucose or white bread). Over the past three decades, the GI concept has been subjected to extensive research confirming its reproducibility, application to mixed meals, and clinical usefulness in the treatment of diabetes and hyperlipidemia. The average American diet has a high GI.
The foods that produce the highest glycemic response include many of the starchy foods consumed by people in industrialized countries, including bread, breakfast cereals, and potatoes, whether high or low in fiber. This is because the starch can be rapidly digested and absorbed.
The foods with the lowest GI values include pasta, relatively unprocessed cereal foods, baked beans, dairy products, and many types of fruit and vegetables. Sugary foods often cause lower levels of glycemia per gram of carbohydrate than the common starchy staples of western diets. This is because up to half of the weight of carbohydrate is fructose, a sugar that has little effect on glycemia.
High GI (>70)
Breads |
|
|
|
|
|
|
White Bread |
70 |
|
Whole Meal Bread |
72 |
|
French Bread |
95 |
|
|
|
Breakfast Cereals |
|
|
|
|
|
|
Cornflakes |
84 |
|
Rice Krispies |
82 |
|
Cheerios |
83 |
|
|
|
Potatoes |
80-100 |
|
|
|
|
Confectionery |
|
|
|
|
|
|
JeLLy Beans |
80 |
|
Life Savers |
70 |
|
Skittles |
7 |
Moderate GI (56-69) GI
Breads |
|
GI |
|
|
|
|
Sourdough |
57 |
|
Barley bread |
65 |
|
Rye bread |
65 |
|
|
|
Breakfast cereals |
|
|
|
|
|
|
Cream of wheat |
66 |
|
Bran Chex |
58 |
|
Muesli |
66 |
|
|
|
Dairy foods |
|
|
|
|
|
|
Ice cream, full fat |
61 |
|
|
|
Confectionery |
|
|
|
|
|
|
Mars Bar |
65 |
|
Kudos whole grain |
62 |
|
|
|
Fruits |
|
|
|
|
|
|
Banana |
53 |
|
Pineapple |
66 |
|
Pawpaw |
58 |
|
|
|
Rices (high amylase) |
50-60 |
|
|
|
|
|
varieties, e.g. Basmati) |
|
Low GI (<55)
Breads |
|
|
|
|
|
|
Pumpernickel |
41 |
|
Heavy mixed grain |
30-45 |
|
|
|
Breakfast cereals |
|
|
|
|
|
|
All Bran |
42 |
|
Toasted muesli |
43 |
|
Psyllium-based processed cereal |
42 |
|
|
|
Dairy foods |
|
|
|
|
|
|
Milk, full fat |
27 |
|
Milk, skim |
32 |
|
Yogurt, low fat, fruit |
33 |
|
|
|
Confectionery |
|
|
|
|
|
|
Chocolate (Dove) |
45 |
|
M&Ms |
33 |
|
Snickers Bar |
41 |
|
|
|
Fruits |
|
|
|
|
|
|
Apple |
36 |
|
Orange |
43 |
|
Peach |
28 |
|
|
|
Legumes |
|
|
|
|
|
|
Lentils |
28 |
|
Soybeans |
18 |
|
Baked beans (canned) |
48 |
Short-term studies in lean healthy people, obese individuals, and people with diabetes show consistently higher day-long insulin levels with diets based on high-GI foods in comparison with low GI diets of similar nutrient composition.
Because fasting hyperinsulinemia (increased insulin in the blood) has been found to be an independent risk factor for coronary heart disease, differences in the levels of insulin in the blood after eating caused by food can no longer be ignored. Even a small physiologic increase in insulinemia for as little as 3 to 5 days induces severe insulin resistance in healthy young subjects.
In people with diabetes, there are particularly important reasons to promote low-GI foods in dietary choices. One reason is that they show greater insulin resistance than non-diabetic individuals, and consumption of high-GI foods results in far more exaggerated glycemic and insulin responses, which may lead to worsening insulin resistance and eventually the need for drug or insulin therapy.
Furthermore, higher day-long insulin levels promote carbohydrate oxidation at the expense of fatty acid oxidation, thereby encouraging synthesis of very-low-density lipoprotein cholesterol (VLDL) in the liver and fat storage in adipose tissue. A combination of high-GI carbohydrate and high fat (of any type) in a meal therefore may be additive in promoting weight gain.
The GI of the diet may be the most important dietary factor in preventing Type 2 diabetes. Two large-scale prospective studies, one in female nurses and one in male health professionals, showed that diets with a high glycemic load (GI x carbohydrate content) increase the risk of developing Type 2 diabetes after controlling for known risk factors such as age and body mass index.
This is a condition associated with insulin resistance, elevated blood lipids, high blood pressure and obesity. Increase insulin circulating in the blood is linked with ALL of these elements of the metabolic syndrome (previously called, “insulin resistance” and “Syndrome X”) These are conditions which are primarily seen in affluent western cultures and therefore the GI of foods eventually may be linked with all so-called diseases of affluence.
In healthy people as well as those with Type 2 diabetes, high-carbohydrate diets have been shown to worsen aspects of the blood lipid profile, including the TG, VLDL, HDL, and lipoprotein a. Individuals with insulin resistance are more susceptible to these adverse effects. However, this effect of high-carbohydrate diets is almost certainly linked to the rate of absorption of the carbohydrate, because strategies that slow down digestion and absorption (high soluble fiber, low GI, [Alpha]-glucosidase therapy) improve these parameters. The concerns with usual (i.e., high-GI) high-carbohydrate diets have led some experts to recommend high intake of monounsaturated and polyunsaturated oils in place of carbohydrate. However, it must be remembered that the caloric content of fats is twice what it is of carbohydrates. Eating of “energy-dense” fats can incline a person to over consumption.
The GI has implications for weight control in people with diabetes because slowly digested carbohydrate is associated with higher satiety. The prolonged presence of food in the gut may stimulate chemical and pressure receptors that signal satiety. Low-insulinemic diets have been shown to increase the rate of weight loss on energy-restricted diets through the mechanism of lower insulin levels. Thus, low-GI diets may promote weight control by both enhancing satiety and reducing insulinemia.
Unfortunately, some foods have been rated as "good" or "bad" simply on the basis of their GI. It is certainly not appropriate to substitute boiled potatoes (high GI) with potato crisps (lower GI). Large amounts of fat in a food reduce glycemia by slowing down gastric emptying, but glucose tolerance to the subsequent meal is impaired. Thus, high-fat foods may be seen in a "falsely favorable" light if the GI is the only criterion for selection. The total amount of carbohydrate, the amount and type of fat, and the fiber, micronutrient, and salt contents of a food are also important considerations. The proper use of the GI is to compare foods within categories of similar nutrient profile.
The GI is the fundamental principle underlying the relationship between carbohydrate intake and the consequent glycemic response, yet some dietary recommendations for people with diabetes still ignore it. The American Diabetes Association guidelines state that first priority should be given to the total amount of carbohydrate consumed rather than its source, and detailed carbohydrate counters exist to equip people with diabetes in doing this. This advice ignores twofold to threefold differences in glycemia for the same quantity of carbohydrate in common foods: potato versus pasta, yogurt versus ice cream, cornflakes versus All Bran. Although the amount of carbohydrate consumed may be a consideration in refining glycemic control, the question of "what to eat" is one that naturally precedes the question of "how much to eat." Guidance on appropriate food choices should, at least initially, be a primary goal of nutrition education for people with diabetes.
The information contained in the GI is the basis on which recommendations about carbohydrate intake should be made. First, the GI dispels the myth that foods containing refined sugars have a greater glycemic impact than starchy staples such as bread. This has forced us to reassess the range of carbohydrate choices recommended to the person with diabetes, in effect expanding, rather than limiting, food choices. Foods such as sweetened breakfast cereals, low-fat flavored dairy foods, and sweetened baked goods are some examples of nutritious foods now appearing on diet sheets that were once forbidden to people with diabetes. Allowing sugar as a carbohydrate improves dietary compliance by making fairly bland cereal grains, such as oatmeal, more palatable.
The fiber content of breakfast cereals and fat content of baked goods, for example, are important considerations for people with diabetes. Sugar content no longer has to be the sole criterion of choosing foods for a diabetic. A moderate intake of refined sugars (10% to 12% energy) is not associated with obesity, micronutrient deficiency, or undesirable effects on blood lipids or insulin sensitivity. Conversely, there is good evidence that low sugar intakes are associated with higher intakes of saturated fat, higher body weight, and a diet with a higher GI.
Unfortunately, some dietitians have found the liberalization of sugar that goes hand in hand with GI advice can be one of the major stumbling blocks to general acceptance of the GI. The "pure, white, and deadly" image of sugar is well entrenched.
The GI identifies those sources of carbohydrate that have the lowest glucose-raising potential. The concept that slowly digested and absorbed carbohydrate has the least impact on blood sugar levels is readily understood. A useful approach to convey the concept is to represent all high-carbohydrate-low-fat foods as "good," but some as "better" and others as "best," making the distinction on the basis of GI and fiber content. All high-carbohydrate-low-fat foods may be regarded as useful or "good" because carbohydrate is quantitatively the most limiting nutrient in western diets (we eat only 40% to 45% of our energy as carbohydrate instead of the recommended 55%), but some of them may be "better" or "best," depending on the context.
The "Good-Better-Best" System of Choosing High Carbohydrate Foods
| White bread | Whole meal bread | Grainy breads |
| Soft drink | Fruit juice | Piece of fruit |
| Potatoes | Pasta | Baked beans |
In practice, therefore, applying the GI is simply a matter of substitution: A system of "this for that." Life itself is a matter of choices and in choosing life-sustaining foods, one must make an informed choice. Moderating the glycemic index of the foods you eat can help you make wiser choices. Meat and potatoes as staples is not a wise choice. Most fruits and vegetables, filled as they are with fiber and low-glycemic indexes are healthy.
The entire discussion of glycemic index revolves around the need to maintain a normal insulin level in the body. Insulin -- a hormone produced by the pancreas and which helps regulate your blood sugar -- also has many negative side effects. (see The Examiner May 29, 2003 and June 5, 2003 for an in-depth discussion of the effects of insulin) The control of your insulin levels has important implications for the prevention and treatment of the major causes of morbidity and mortality in western countries, including Type II (non-insulin-dependent) diabetes, coronary heart disease, and obesity.
The principle source of "sugar" in your diet is carbohydrates. There is also some "sugar" which is produced by a process called "gluconeogenesis" (the "genesis" of "new" sugar from other food classes such as protein) Sugar is one of the major food sources of energy, along with fat in your diet. At least 55% of energy should be derived from carbohydrate and the bulk of those carbohydrate foods should be those rich in dietary fiber (non-starch polysaccharide and with a low glycemic index).
The problem with the glycemic index is that to determine it, a person had to consume a sufficient amount of carbohydrates (usually 50 grams) to see a rise in blood sugar. For most vegetables, it is simply too difficult to consume this amount of carbohydrate. For steamed broccoli you would have to consume 16 cups. Therefore, nutritionist began looking at a concept called "Glycemic Load."
The glycemic load is the actual amount of an insulin-stimulating carbohydrate consumed multiplied by the glycemic index for that carbohydrate. A healthy diet is obtained through insulin moderation which can best be achieved by consuming primarily low-density carbohydrates that also have a low-glycemic index. Look at the following comparison.
Food |
Amount |
Glycemic Index |
Glycemic Load |
Pasta |
1 cup |
59 |
3068 |
Apple |
1 |
54 |
972 |
Broccoli |
2 cups |
50 estimated* |
150 |
Even with a similar glycemic index, the pasta generates twenty times as much insulin response as a cup of broccoli. *Broccoli’s GI estimated is due to the fact that it has not been possible to get anyone to eat enough broccoli in one sitting to measure the GI.
Food |
Grams |
Glycemic Index |
Glycemic Load |
Apple |
18 grams |
54 |
972 |
Apple juice |
8 ounces, 29 grams |
57 |
1,653 |
Banana |
32 grams |
70 |
2,528 |
Orange |
10 grams |
63 |
630 |
Orange Juice |
8 ounces - 26 grams |
66 |
630 |
Raisins |
1 cup, 112 grams |
91 |
10,192 |
Black Bean (boiled) |
1 cup, 41 grams |
43 |
1,763 |
Black Bean Soup |
1 cup, 56 grams |
91 |
2,458 |
Linguine Pasta |
1 cup, 56 grams |
79 |
4,424 |
Grape nuts |
1 cup, 198 grams |
96 |
10,368 |
Coca cola regular |
39 grams |
90 |
3,510 |
- Keep your glycemic load below 3,000 in any one meal. You can see that if you have a Coca Cola with your hamburger, you have exceeded that glycemic load with your beverage.
- The more processed a food, the higher the glycemic load. Boiled beans have a much lower glycemic load than the same volume of canned beans. And when you make any bean into a soup, the glycemic load skyrockets because the prolonged cooking breaks down the cell walls of the bean, making it easier for the body to digest it into simple sugars for absorption.
The glycemic load concept makes it clear why consuming most of your carbohydrates from high-quality vegetables is the key to maintaining insulin levels within the appropriate zone. (The material on the concept of glycemic load is drawn from Dr. Barry Sears' books The OmegaRx Zone and The Zone.)
Design your eating habits around managing your blood sugar levels and you will feel better, be better and function better for as long as you live.
The conversation we had in my office about the matters we describe above resulted in your volunteering your commitment to working together to achieve your optimal health over the coming year. With my cell phone number, you will be able to give me frequent progress reports on your:
- Blood sugar
- Medication adherence
- Exercise adherence
- Dietary adherence
- Changes in your health
The goals you set for yourself will be monitored. Together, we will see your success for it is indeed the two of us in this together. In the next year, we agreed to establish a consistent exercise program, reduce your weight by 5-8%, get your HbA1c to goal, reduce your LDL to at least less than 110 and control your blood pressure. I look forward to your next call and to seeing you again in six weeks. I look forward to your next phone call and to your next visit.
|