|
Few syndromes integrate as wide a range of conditions and involve as high a percentage of the populace as the Metabolic Syndrome. In addition, few conditions, which have the devastating impact on health and wellness, are as responsive to conservative measures as is the Metabolic Syndrome. Yet, generally, in medical practice little attention is given to the Metabolic Syndrome.
People with the metabolic syndrome are at increased risk for cardiovascular disease and for increased mortality from both cardiovascular disease and all causes. In addition, components of the metabolic syndrome are risk factors for diabetes. Because of the increased risk for morbidity and mortality associated with the metabolic syndrome, an understanding of this syndrome is critical both as a public health strategy and as a part of daily clinic practice.
SETMA’s Metabolic Suite of Templates are built so as to make it very easy to establish the diagnosis, to prescribe treatment, to monitor progress and to evaluate patients for the comorbidities associated with the syndrome.
The Cardiometabolic Risk Syndrome Suite of Templates may be launched from:
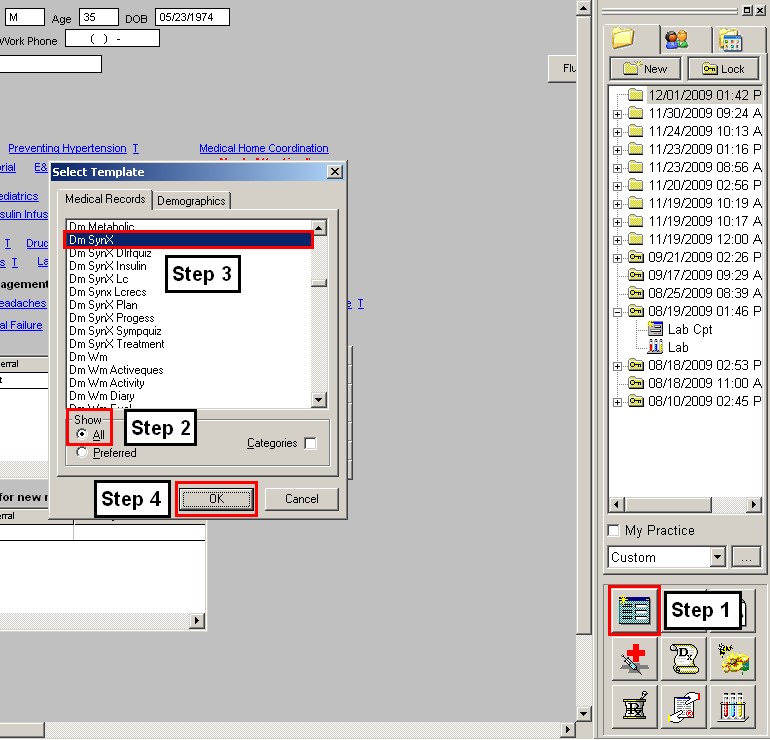
AAA Home
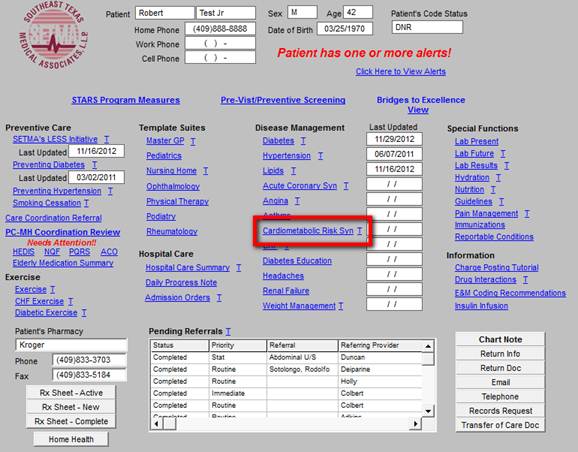
Main Tool Bar Template Icon
Other Disease Management Tools
When the Cardiometabolic Risk Syndrome Suite of Templates is accessed, a pop-up automatically appears which states the following:
Insulin Resistance & Cardiometabolic Risk Syndrome
There is general agreement that insulin resistance is the underlying cause of the cardiometabolic risk syndrome. Insulin resistance and resulting hyperinsulinemia have been implicated in the development of:
- Glucose intolerance and
- Progression to Type 2 Diabetes
- Hypertriglyceridemia
- Hypertension
- Polycystic Ovarian Syndrome
- Hypercoagulability
- Vascular Inflammation
- Atherosclerotic cardiovascular disease
- Myocardial Infarction
- Stroke
- Myriad end-organ diseases
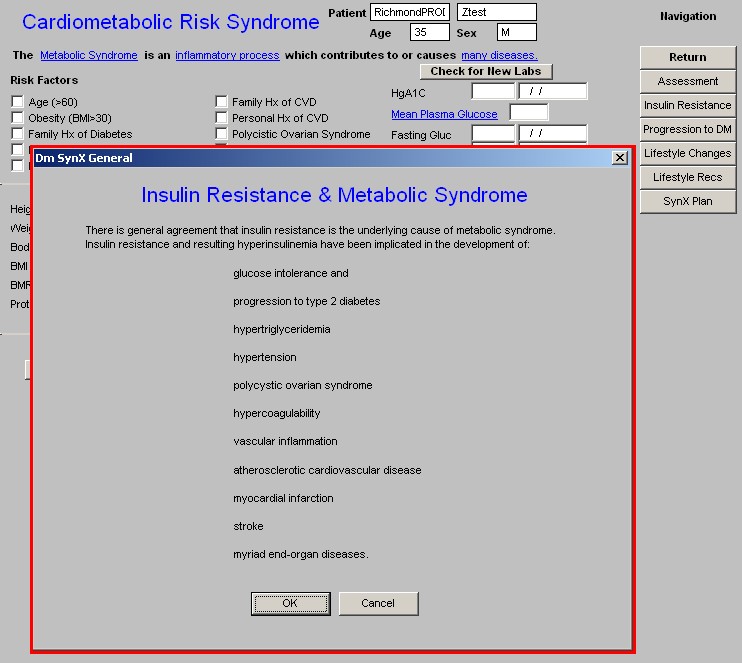
The above is launched each time the Master Metabolic Syndrome Template is accessed because it is imperative for healthcare providers to develop the awareness of how pivotal and pervasive this condition is to the health of our patients.
After reviewing the Insulin Resistance & Cardiometabolic Risk Syndrome pop-up, click “OK.” The pop-up is closed, displaying the Master Metabolic Syndrome Template.
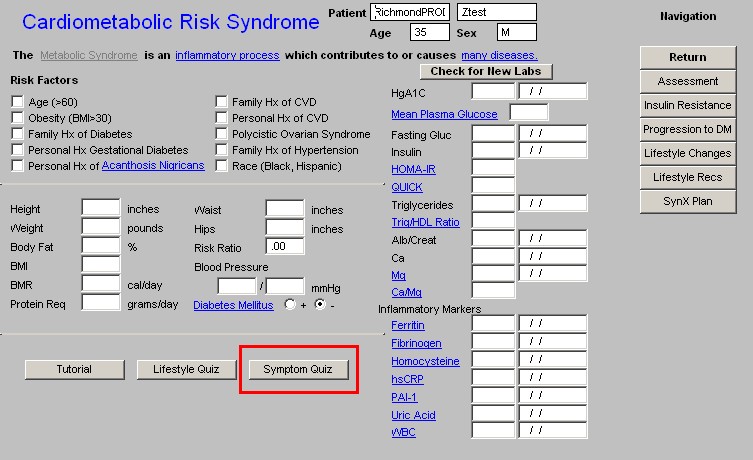
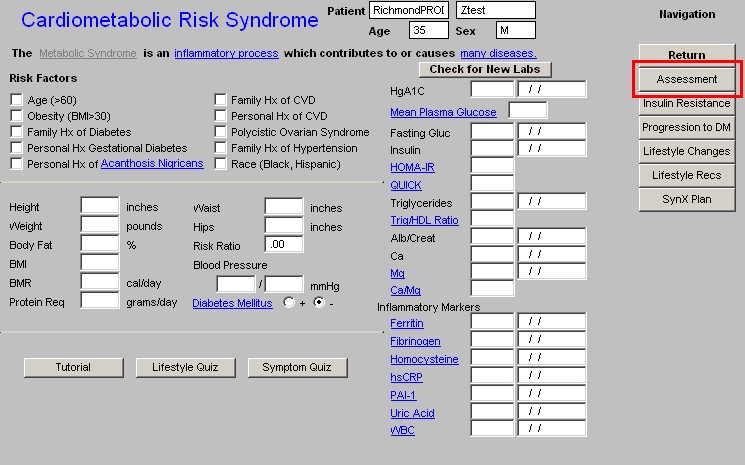
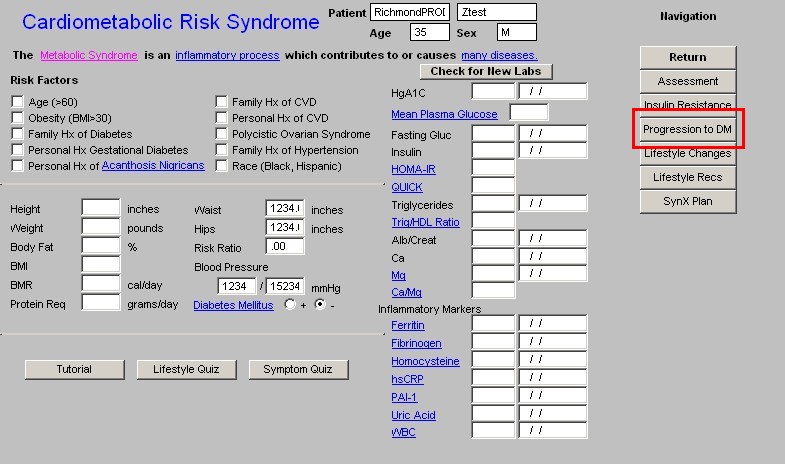
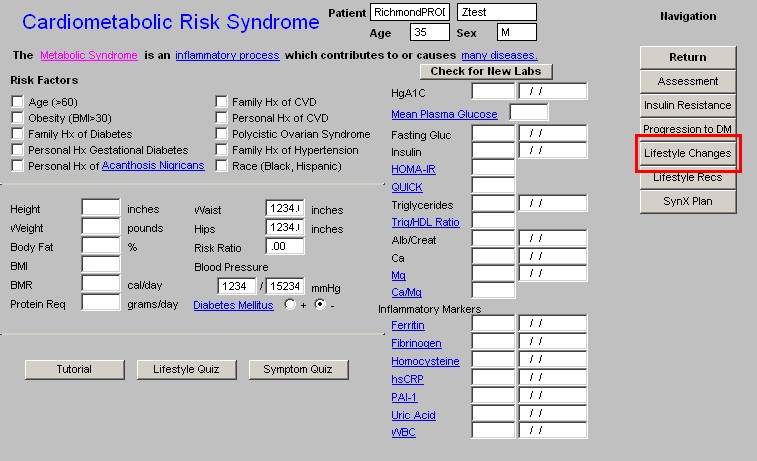
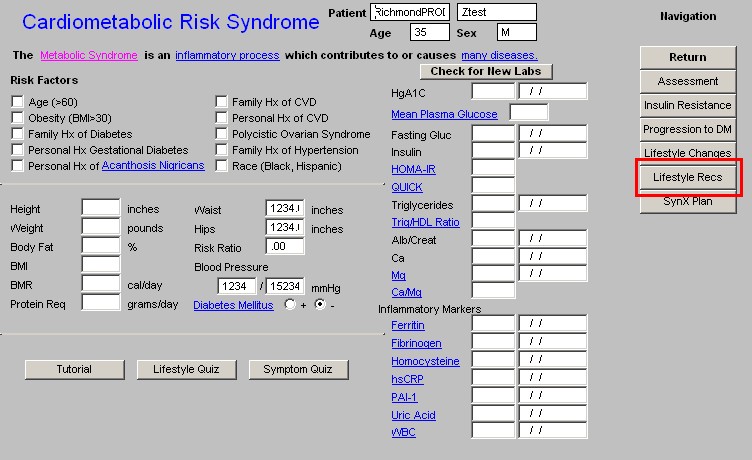
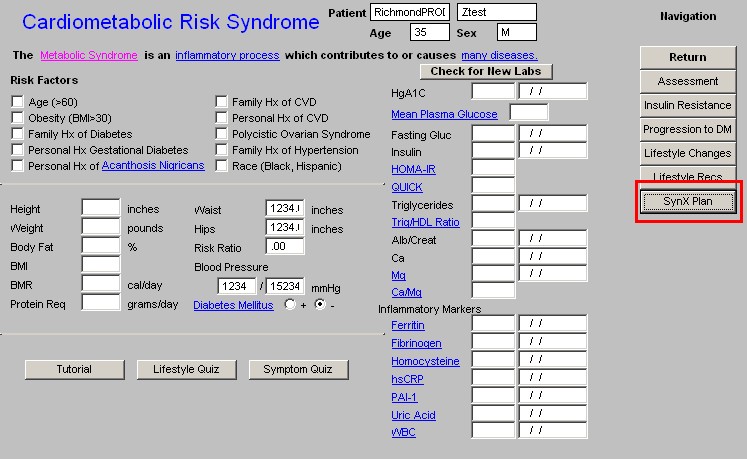
At the top of the Master Cardiometabolic Risk Syndrome Template, in addition to the name of the Suite, the patient’s name, age and sex appears.
Beneath that is the following statement:
“The Cardiometabolic Risk Syndrome is an inflammatory process which contributes to or causes many diseases.”
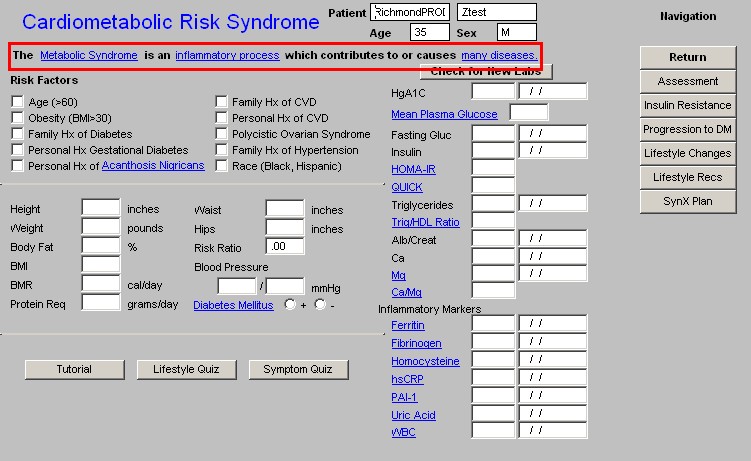
In the above statement, the three highlighted and underscored phrases indicate links to the following information.
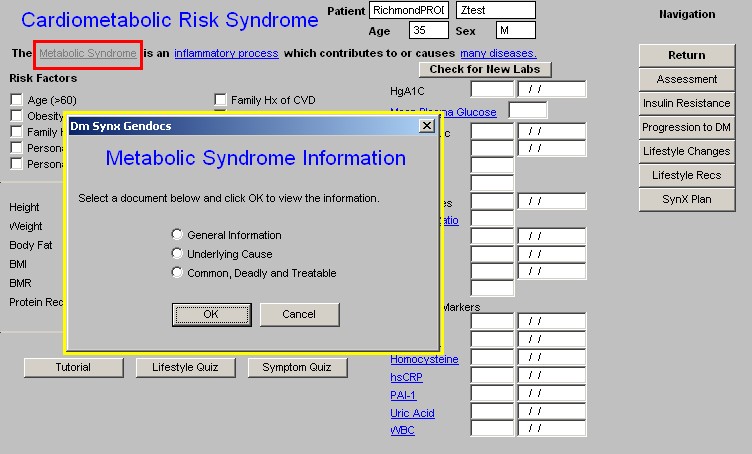
When clicked the Cardiometabolic Risk Syndrome link launches a pop-up which displays access to three documents concerning the syndrome:
- General Information
- Underlying Causes
- Common, Deadly and Treatable which is further titled “Syndrome X Common, deadly, treatable - and poorly recognized.”
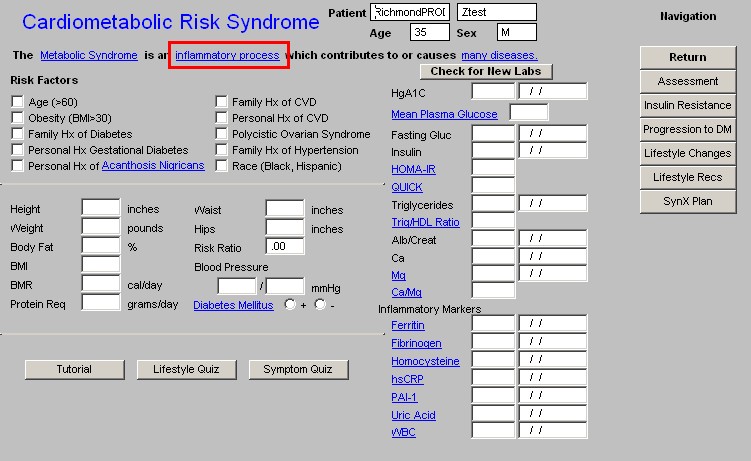
The second highlighted and underscored phrase is Inflammatory Process which is a link which launches a document entitled, “Metabolic Syndrome” which is extracted from Consultant, May 2004, Vol. 44, No 6, pp. 859ff)
In part, this document states:
Insulin resistance may be an inflammatory state:
- ATP III lists prothrombotic and proinflammatory states as components of the metabolic syndrome.
- Abdominal obesity is one cause of elevated levels of the inflammatory marker CRP because excess adipose tissue releases inflammatory cytokines that elicit higher CRP levels.
- As the number of components of the metabolic syndrome increases from 0-5, the CRP level rises linearly.
- CRP adds important prognostic information regarding future vascular risk at all levels of severity of the metabolic syndrome.
The Metabolic Syndrome and Cardiovascular Risk
- The metabolic syndrome increases risk for CHD and stroke 3 fold
- The metabolic syndrome increases risk of cardiovascular death 5 fold
- The metabolic syndrome increases the risk of development or progression of carotid atherosclerosis.
- Many Diseases – the third highlighted and underlined phrase launches the pop-up discussed above which is entitled, “Insulin Resistance & Metabolic Syndrome.” In that this is automatically launched only the first time the Metabolic Syndrome Suite is accessed during each visit, this link allows you to review this material again during a visit, if necessary.
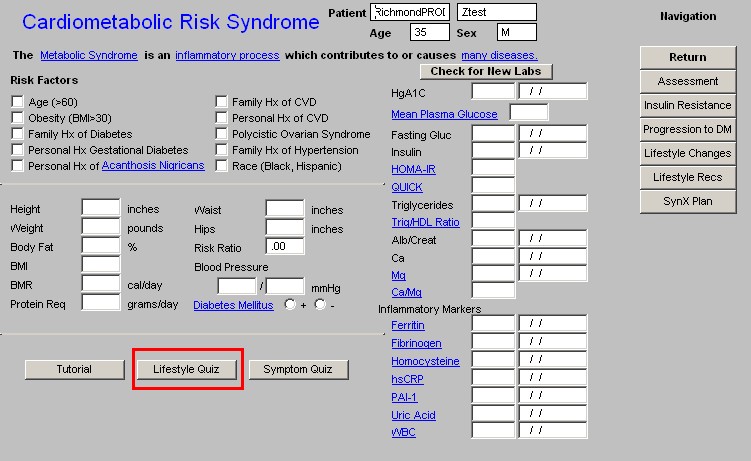
Beneath the above discussed statement, the Master Cardiometabolic Risk Syndrome Template is organized into thee columns.
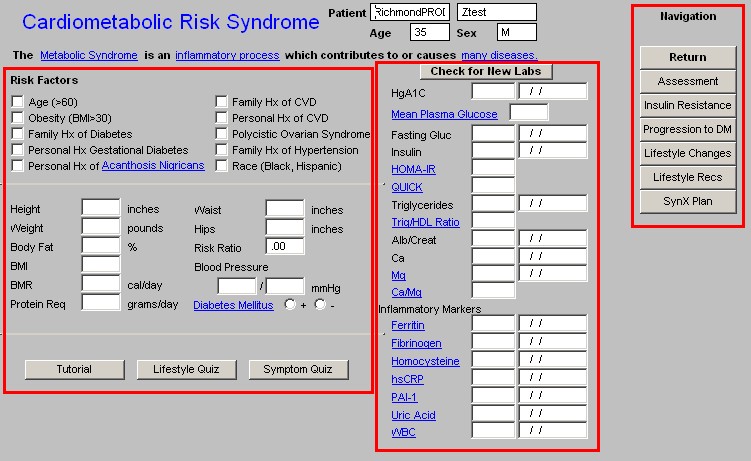
The first column has three parts:
Risk Factors – this is a list of conditions which increase the potential for a patient having Insulin Resistance and the Metabolic Syndrome. The risk factors which are captured elsewhere in the EMR are automatically documented here.
Beneath this are the patient’s vital signs, body composition measurements and designation as to whether or not the patient has diabetes. These are automatically populated from the GP Master Nursing Template.
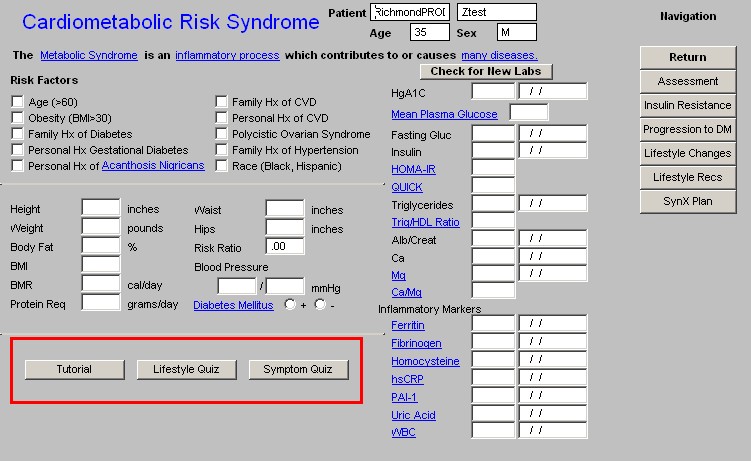
At the bottom of Column 1 are three buttons: Tutorial, Lifestyle Quiz and Symptom Quiz.:
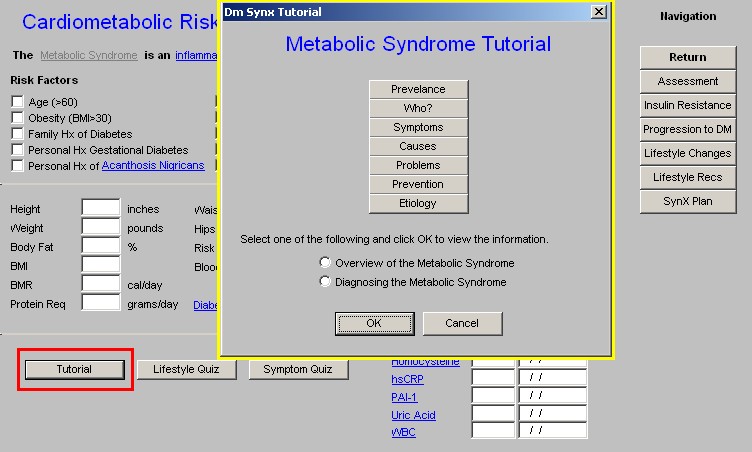
- Tutorial – depressing this button launches a pop-up with the following seven buttons:
- Prevalence
- Who?
- Symptoms
- Causes
- Problems
- Prevention
- Etiology
Two additional documents are also launched from here entitled
- Overview of the Metabolic Syndrome
- Diagnosing the Metabolic Syndrome
- When the Prevalence button is depressed, in part the following material appears:
What is metabolic syndrome?
Metabolic syndrome is a collection of health risks that increase your chance of developing heart disease, stroke, and diabetes. The condition is also known by other names including Syndrome X, insulin resistance syndrome, and dysmetabolic syndrome.
According to a national health survey, more than one in five Americans has metabolic syndrome. The number of people with metabolic syndrome increases with age, affecting more than 40 percent of people in their 60s and 70s.
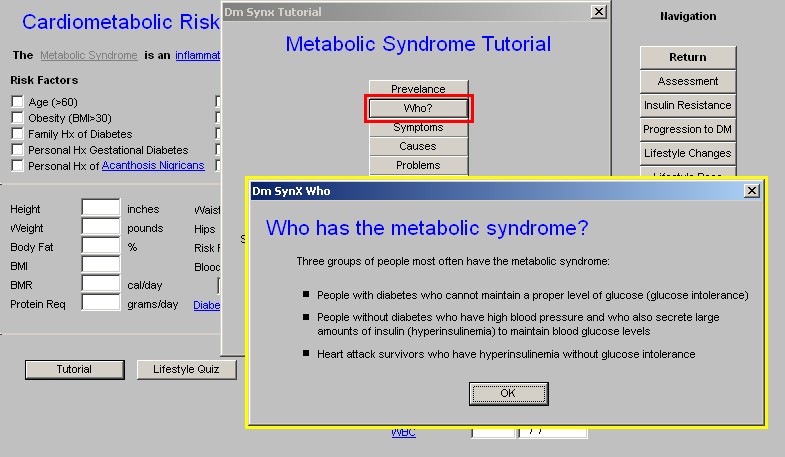
- When the Who? button is depressed, the following material is displayed:
Who has the metabolic syndrome?
Three groups of people most often have the metabolic syndrome:
- People with diabetes who cannot maintain a proper level of glucose (glucose intolerance)
- People without diabetes who have high blood pressure and who also secrete large amounts of insulin (hyperinsulinemia) to maintain blood glucose levels
- Heart attack survivors who have hyperinsulinemia without glucose intolerance
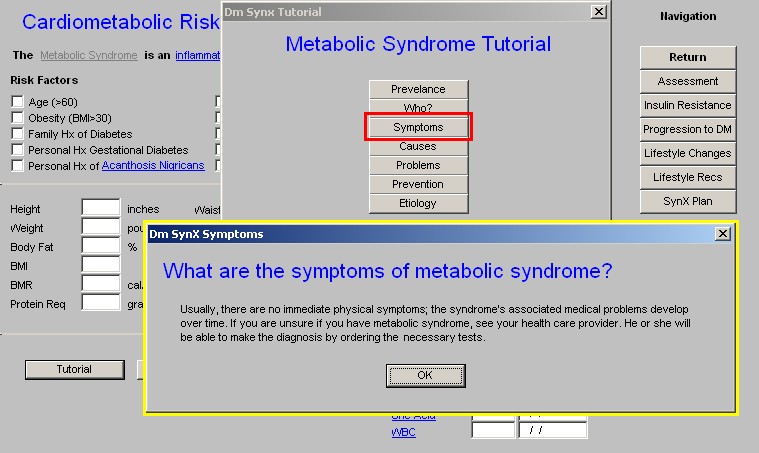
- When the Symptoms button is depressed, the following material is displayed:
What are the symptoms of metabolic syndrome?
Usually, there are no immediate physical symptoms; the syndrome's associated medical problems develop over time. If you are unsure if you have metabolic syndrome, see your health care provider. He or she will be able to make the diagnosis by ordering the necessary labs.
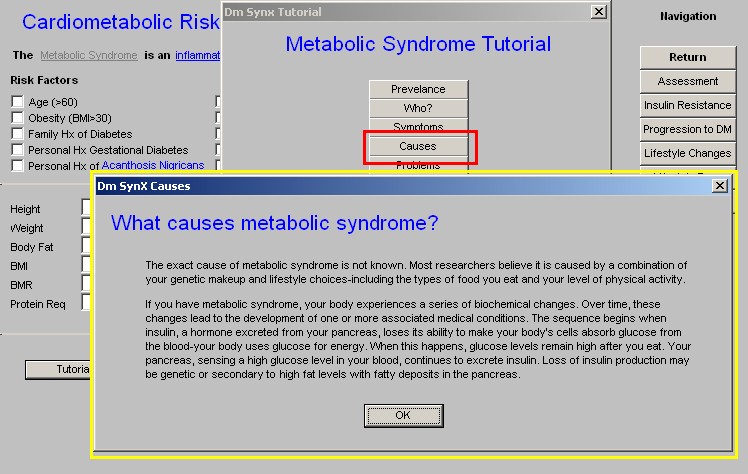
- When the Causes button is depressed, in part the following material is displayed:
What causes metabolic syndrome?
The exact cause of metabolic syndrome is not known. Most researchers believe it is caused by a combination of your genetic makeup and lifestyle choices-including the types of food you eat and your level of physical activity.
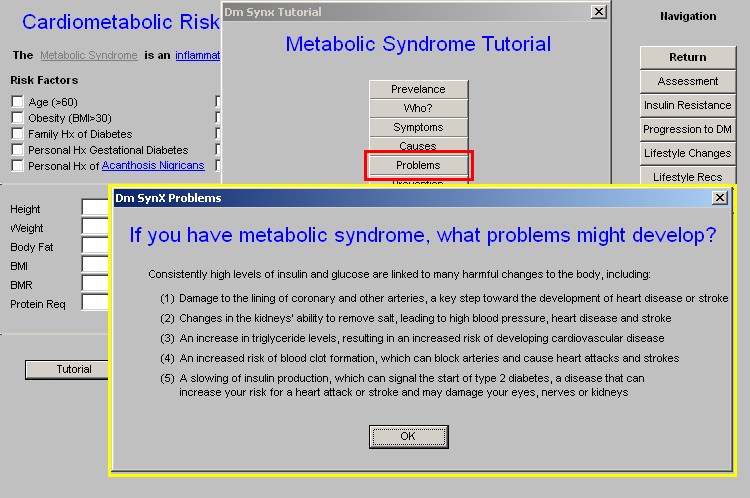
- When the Problems button is depressed, the following material is displayed:
If you have metabolic syndrome, what problems might develop?
Consistently high levels of insulin and glucose are linked to many harmful changes to the body, including:
- Damage to the lining of coronary and other arteries, a key step toward the development of heart disease or stroke
- Changes in the kidneys' ability to remove salt, leading to high blood pressure, heart disease and stroke
- An increase in triglyceride levels, resulting in an increased risk of developing cardiovascular disease
- An increased risk of blood clot formation, which can block arteries and cause heart attacks and strokes
- A slowing of insulin production, which can signal the start of type 2 diabetes, a disease that can increase your risk for a heart attack or stroke and may damage your eyes, nerves or kidneys
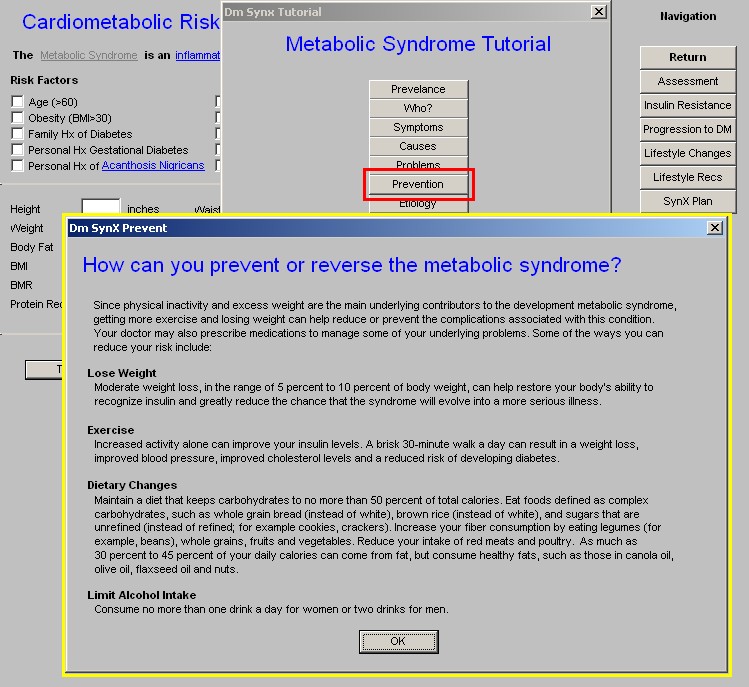
- When the Prevention button is depressed, the following material is displayed:
How can you prevent or reverse the metabolic syndrome?
Since physical inactivity and excess weight are the main underlying contributors to the development metabolic syndrome, getting more exercise and losing weight can help reduce or prevent the complications associated with this condition. Your doctor may also prescribe medications to manage some of your underlying problems. Some of the ways you can reduce your risk include:
- Lose Weight
- Exercise
- Dietary Changes
- Limit Alcohol Intake
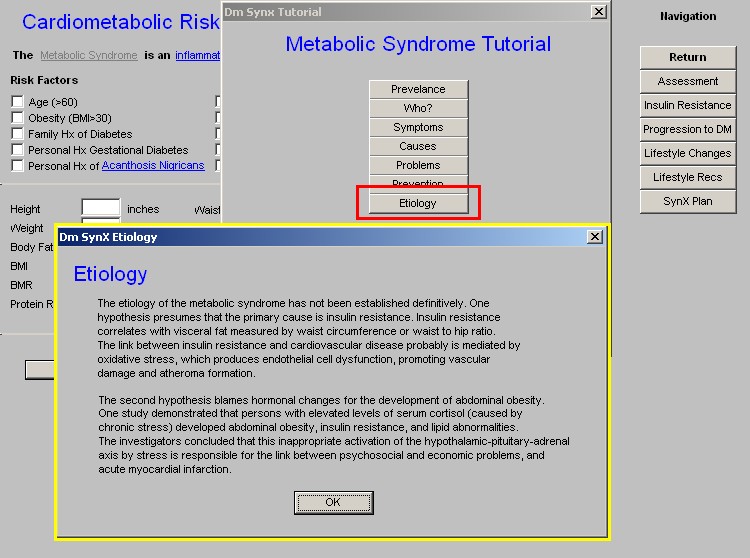
- When the Etiology button is depressed, the following material is displayed:
Etiology
The etiology of the metabolic syndrome has not been established definitively. One hypothesis presumes that the primary cause is insulin resistance. Insulin resistance correlates with visceral fat measured by waist
circumference or waist to hip ratio. The link between insulin resistance
produces endothelial cell dysfunction, promoting vascular damage and
atheroma formation.
On the Tutorial template, after the seven tutorial pop-ups which are described above, there appears the following instruction:
Select one of the following and click OK to view the information.
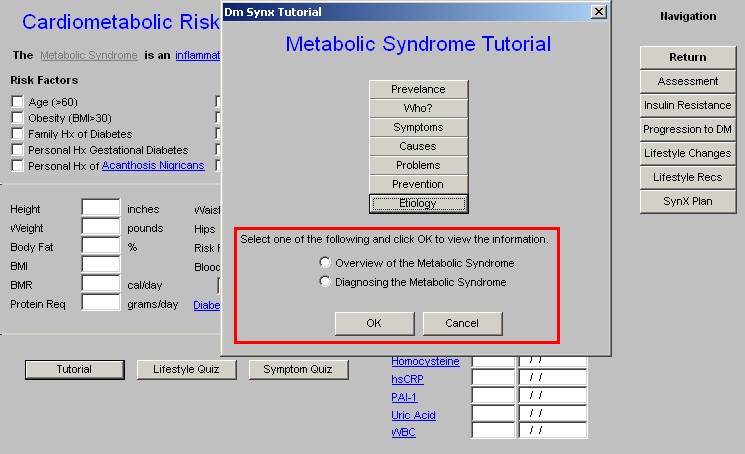
The two options are:
- Overview of the Metabolic Syndrome
- Diagnosing the Metabolic Syndrome
The final two buttons at the bottom of the Master Metabolic Syndrome Template are:
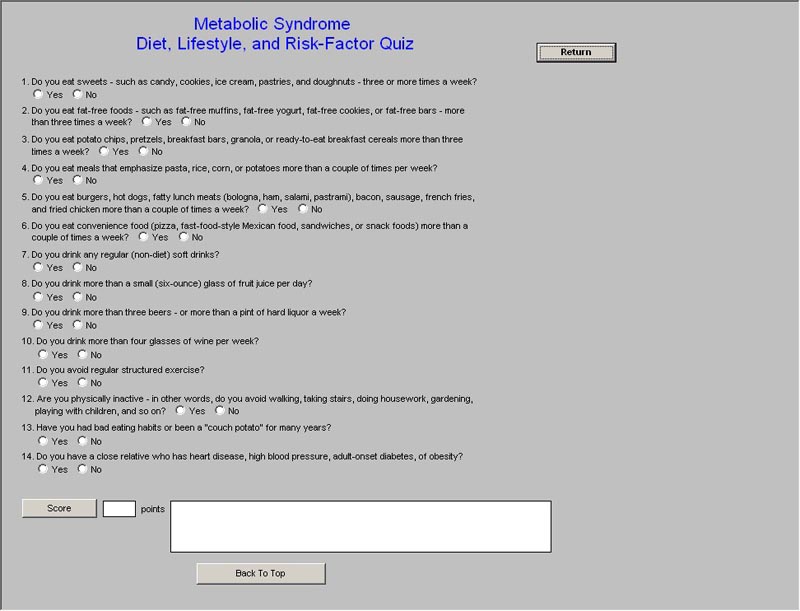
- Lifestyle Quiz – Metabolic Syndrome Diet, Lifestyle. And Risk-Factor Quiz – This is a fourteen-question quiz which is scored. The following is the scoring scale and the conclusion:
- Based on your responses you have a low risk of developing insulin resistance and the metabolic syndrome.
- You answered yes to three or more questions which suggest that you at risk for developing insulin resistance and the metabolic syndrome. The higher your score, the higher your risk is. The higher your score, the higher your risk is.
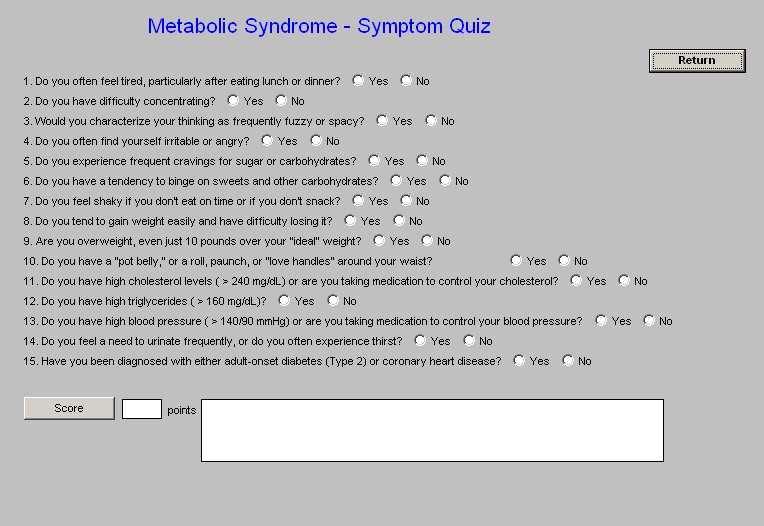
- Symptom Quiz – Metabolic Syndrome – Symptom Quiz – This is a fifteen question quiz which is scored. Some questions have more weight than others. The maximum score is 58. The following is the scoring scale and the conclusion for each:
- 0-3 You have minimal risk for insulin resistance and Syndrome X.
- 4-10 You probably have some degree, or at least the beginning stages, of insulin resistance and possibly Syndrome X. It's important to make diet and lifestyle changes to reverse this trend and reduce your risk of disease.
- 10-20 You probably have insulin resistance and very probably Syndrome X. It's time to take action to nip the process in the bud before your health gets any worse.
- 21-58 You almost assuredly have Syndrome X. It is imperative that you take strong corrective action with your diet, physical activity level, and the use of supplements.
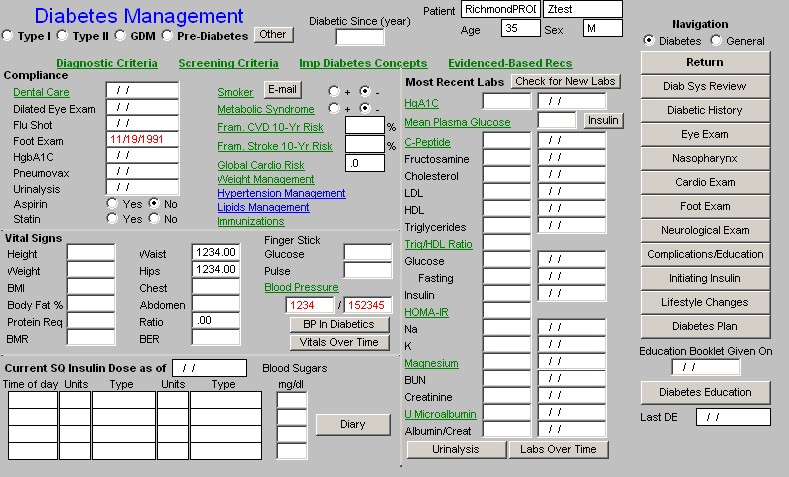
Column 2 –
At the top of the column is a button entitled Check for New Labs. When this button is activated, the system searches for the latest lab work to populate the lab fields below.
The laboratory results which are displayed on this template and the significance of those which are less familiar are:
Fasting Gluc – “Fasting” is defined as a twelve-hour fast for metabolic analysis.
Insulin – the insulin level should be done after a 12-hour fast also.
HOMA-IR – Homeostasis Model Assessment of Insulin Resistance. This result is automatically calculated when a fasting plasma glucose and a fasting insulin are obtained at the same time. A value above 2 is diagnostic of insulin resistance
QUICK – (Quantitative Insulin Sensitivity Check Index) This is another calculation for insulin sensitivity. It is particularly useful in patients with hypertension. The equation for QUICK utilizes the same raw data as HOMA-IR, i.e., fasting plasma glucose and fasting insulin, but handles the data differently. Because this formula requires the use of logarithms, it is not presently functional.
Triglycerides
Trig/HDL Ratio -- If the patient has had his/her lipids checked, this ratio will be automatically calculated. If the value is over 2, it is highly suggestive of insulin resistance. The American Association of Clinical Endocrinologist’s (AACE) Consensus Conference on the Insulin Resistance Syndrome, 2002, stated, “The triglyceride-to-HDL ratio may be a better marker than the fasting insulin level, particularly as it shows similar correlation with insulin sensitivity.”
Alb/creat – Because the insulin resistance syndrome dramatically affects renal function, this marker for the early diagnosis of renal damage is important.
Ca++
Mg++
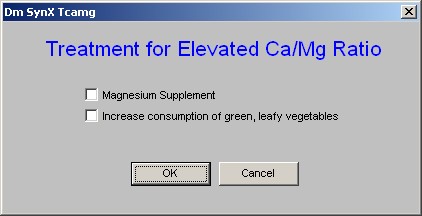
Ca++/Mg++ -- Blood coagulation that takes place in blood vessels gives rise to thromboses and emboli that can result in heart attacks and strokes. Since it has long been known that Ca enhances the coagulation process while Mg inhibits it, the high Ca/Mg ratio in the Metabolic Syndrome X is a likely factor in its thromboembolic complications.
Column 3 –
Navigation – beneath this title are two options. SynX and General.
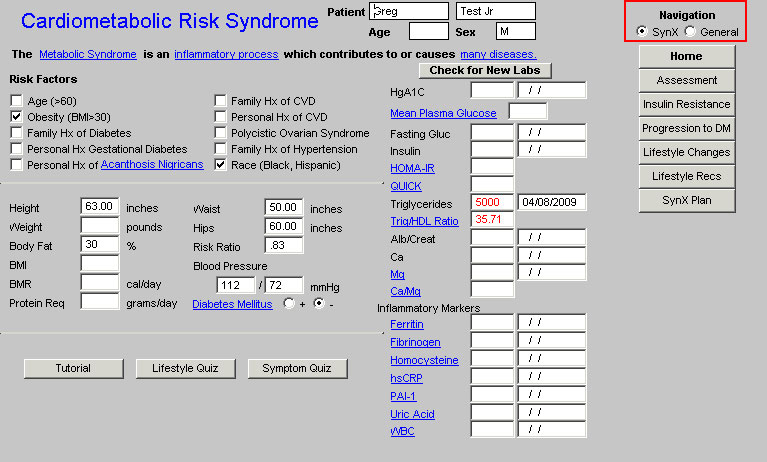
If the radial box in front of SynX is clicked, a set of temples unique to the Metabolic Syndrome Suite appears.
Synx – the templates displayed when this option is checked are:
- Home
- Assessment
- Insulin Resistance
- Progression to DM
- Lifestyle Changes
- Lifestyle Recs
- SynX Plan
If the radial box in front of General is clicked a list of templates which are common to the Master GP Suite appears.
General – the templates displayed when this option is selected are:
- Home
- Chief/Chronic
- HPI
- Histories
- System Review
- Physical Exam
These two sets of templates allow you to complete an entire patient encounter within the Metabolic Syndrome Suite, if you are only dealing with this syndrome in your visit, which is highly unlikely
Metabolic Syndrome Assessment Template
There are a number of criteria for assessing the presence or absence of the Metabolic Syndrome. Since G. M. Reaven gave the Banting Lecture in 1988, in which he coined the term Syndrome X, subsequently referred to as the Insulin Resistance Syndrome and now the Metabolic Syndrome, discussions have continued about the appropriate criteria for establishing this diagnosis. Two principle definitions of the Syndrome now exist; those of the:
- Third Report of the National Cholesterol Education Program Expert Panel on Detection, and Treatment in Adults (Adult Treatment Panel III (ATP III)Evaluation
- World Health Organization (WHO)
The ATP III definition of the Metabolic Syndrome is the one which is most commonly used in this country and is the one which is used in SETMA’s Suite of templates to assess the presence or absence of the Syndrome. However, internationally most researchers use the WHO criteria.
The Metabolic Syndrome Assessment template is organized into four columns:
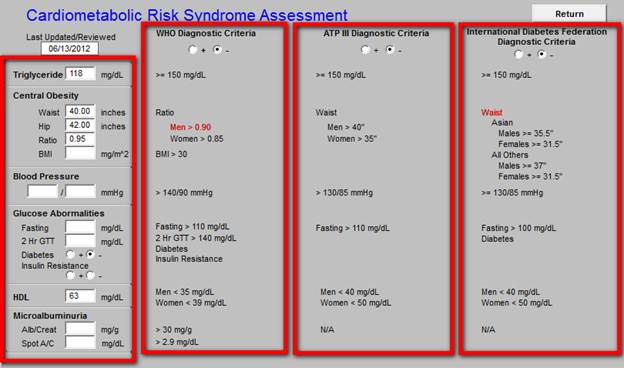
Column 1 contains:
- the lab work and/or
- the information
required for the assessment of the syndrome by either the ATP III and/or the WHO criteria. The components of the assessment for the presence of the Metabolic Syndrome and the patient’s personal values for each component are displayed here.
NOTE: The presence of Insulin Resistance is used as a criterion of the Metabolic Syndrome only by the WHO. If the patient has had his/her lipids checked, this element of the WHO criteria will be automatically populated from the Tri/HDL ratio, as a value above 2 is highly suggestive of insulin resistance.
Or, if the patient has had a fasting plasma glucose and a fasting insulin, this WHO criteria will be automatically populated from the HOMA-IR, which is automatically calculated. A HOMA-IR value above 2 is diagnostic of insulin resistance.
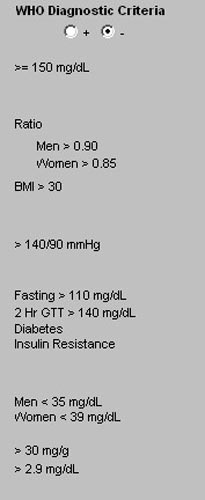
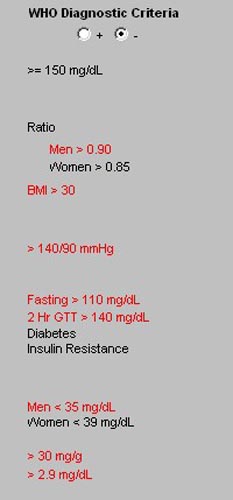
Column 2 -
This is the WHO Diagnostic Criteria
Beneath the name WHO is the assessment of whether, according to the WHO criteria, the patient has the Metabolic Syndrome.
When the patient’s value for any specific aspect of the criteria (which values are displayed in column 1) exceeds the threshold value, thus contributing to the patient’s possibly having the Metabolic Syndrome; the threshold value is turned red.
If the patient has had his/her lipids checked, this element will be automatically populated from the Trig/HDL ratio, as a value above 2 is highly suggestive of insulin resistance.
The American Association of Clinical Endocrinologist’s (AACE) Consensus Conference on the Insulin Resistance Syndrome, 2002, stated, “The triglyceride-to-HDL ratio may be a better marker than the fasting insulin level, particularly as it shows similar correlation with insulin sensitivity.”
If the patient has had a fasting plasma glucose and a fasting insulin, HOMA-IR will be automatically calculated. A value above 2 is diagnostic of insulin resistance.
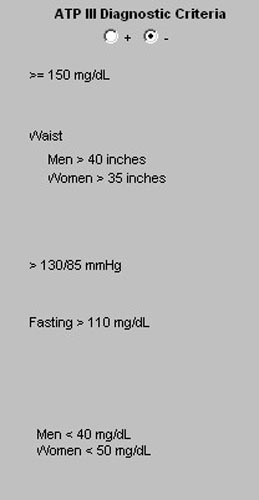
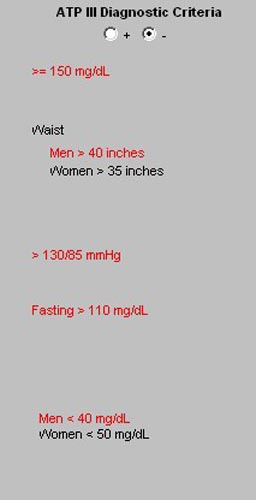
Column 3 -
This is the ATP III Diagnostic Criteria
Beneath the name is the assessment of whether, according to the ATP III criteria, the patient has the Metabolic Syndrome.
When the patient’s value for any specific aspect of the criteria (which values are displayed in column 1) exceeds the threshold value, thus contributing to the patient’s possibly having the Metabolic Syndrome; the threshold value is turned red.
Column 4 -
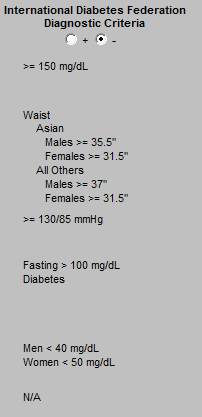
This is the International Diabetes Federation Diagnostic Criteria
Beneath the name is the assessment of whether, according to the International Diabetes Federation, the patient has the Metabolic Syndrome.
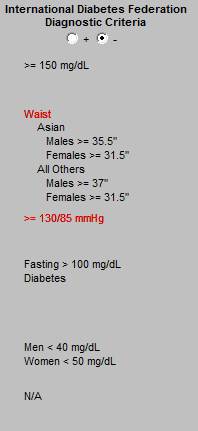
When the patient’s value for any specific aspect of the criteria (which values are displayed in column 1) exceeds the threshold value, thus contributing to the patient’s possibly having the Metabolic Syndrome; the threshold value is turned red.
Minor Features -
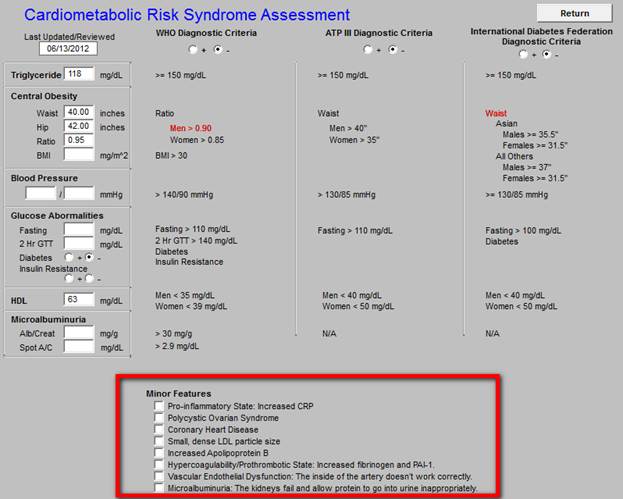
A group of boxes then appear with the heading Minor Features. These are elements of the Metabolic Syndrome but are not used to calculate its presence.
All of the minor features of Insulin Resistance listed below, which are in bold type, are captured in other parts of the EMR and will automatically be documented when that data is available.
- Pro-inflammatory State: Increased CRP
- Polycystic Ovarian Syndrome
- Coronary Heart Disease
- Small, dense LDL particle size
- Increased Apolipoprotein B
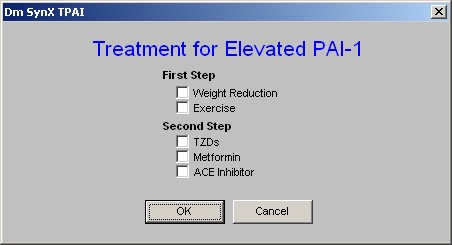
- Hypercoagulability/Prothrombotic State: Increased fibrinogen and PAI-1
- Vascular Endothelial Dysfunction: The inside of the artery doesn’t work correctly.
- Microalbuminuria: The kidneys fail and allow protein to go into urine inappropriately
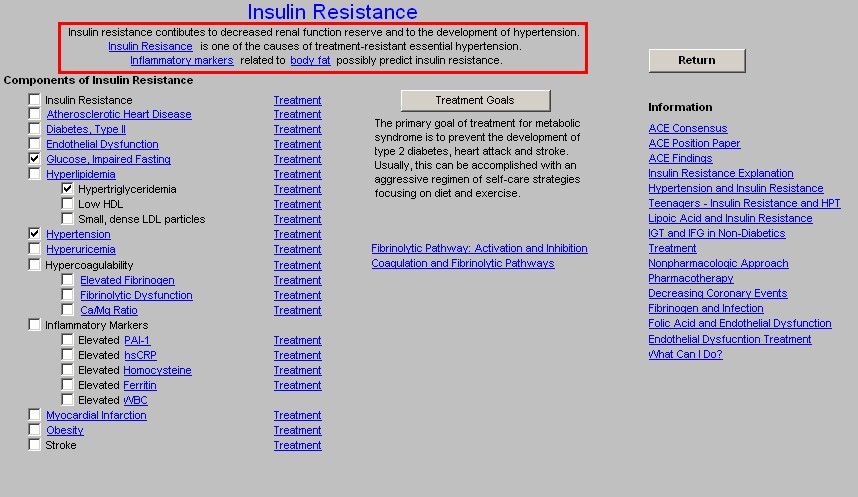
Insulin Resistance Template
The principle feature of the Metabolic Syndrome is insulin resistance. Specifically, this is a condition in which the normal regulatory effects of insulin are not effective:
- The inhibition of hepatic gluconeogenesis – the continuing production of glucose by the liver even in the face of increased insulin levels, which are increased in response to glucose.
- The uptake of glucose by the muscles – “glucose clearance” – the amount of glucose which is taken up by the muscles and other tissues is decreased and consequently the blood sugar is increased.
- This causes an increase in insulin levels. However, because of insulin resistance, the new insulin does not stop the liver from producing more glucose and does not cause the peripheral organs to take up more glucose.
- This vicious cycle continues until the pancreas is exhausted and diabetes type 2 ensues.
The Insulin Resistance Template is accessed from the button by the same name.
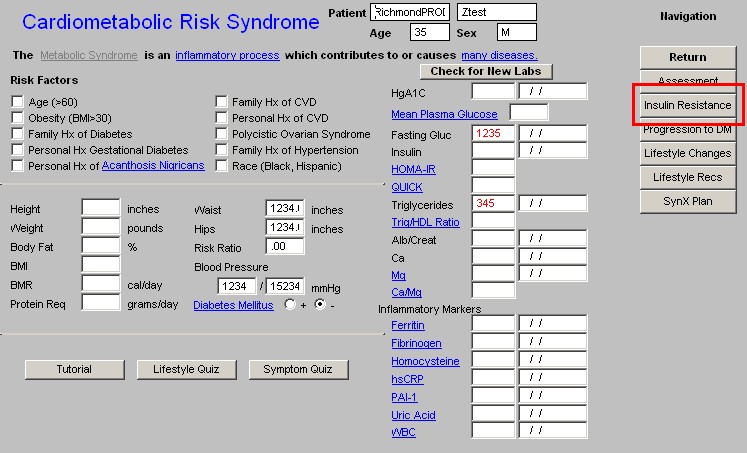
At the top of the Insulin Resistance Template are three statements:
- Insulin resistance contributes to decreased renal function reserve and to the development of hypertension.
- Insulin Resistance is one of the causes of treatment-resistant essential hypertension.
- Inflammatory markers related to body fat possibly predict insulin resistance.
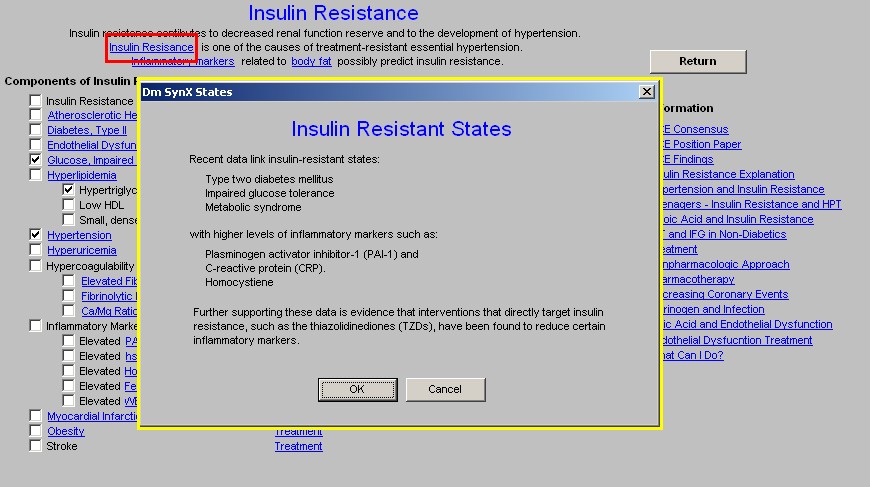
The phrases in bold in the three statements have documents attached to them, which have the following content:
- Insulin Resistance presents the following material on a pop-up:
Insulin Resistant States
Recent data link insulin-resistant to:
- Type two diabetes mellitus
- Impaired glucose tolerance
- Metabolic syndrome
with higher levels of inflammatory markers such as:
- Plasminogen activator inhibitor-1 (PAI-1) and
- C-reactive protein (CRP).
- Homocystiene
Further supporting these data is evidence that interventions that directly target insulin resistance, such as the thiazolidinediones (TZDs), have been found to reduce certain inflammatory markers.
- Inflammatory Markers has a document attached which is entitled “Elevated Levels of Acute-Phase Proteins and Plasminogen Activator Inhibitor-1 Predict the Development of Type 2 Diabetes The Insulin Resistance Atherosclerosis Study (IRAS).”
In part, this study reports:
“Both PAI-1 levels and, as shown more recently, CRP levels predict the development of atherosclerotic disease. On the basis of the results of the present study, it is tempting to speculate that the common antecedent that has been postulated for both atherosclerosis and the insulin resistance syndrome/type 2 diabetes may in fact be chronic inflammation and/or PAI-1 over expression.
If this proves to be the case, then PAI-1 would represent an ideal target for therapeutic interventions that aim to decrease the risk of both cardiovascular disease and type 2 diabetes.”

- Body Fat has a document attached entitled “Obesity,” which addresses the secretion by fat cells of inflammatory markers which promote insulin resistance.
In part, this study states:
Obesity
In humans, obesity is associated with a cluster of abnormalities, including:
- hypertension,
- insulin resistance,
- hyperinsulinemia, and
- elevated levels of PAI-1 (Plasminogen Activator Inhibitor-1)
Although these changes may increase the risk for accelerated atherosclerosis and fatal myocardial infarction, the underlying molecular mechanisms have not been defined. The primary hypothesis of our work is that these changes reflect changes in the gene expression profile of adipocytes in response to alterations in the level of insulin.
This hypothesis is based on our observations that adipocytes synthesize and secrete the proteins:
- PAI-1,
- tissue factor (TF), and
- transforming growth factor-ß
and that the genes for these proteins are markedly upregulated in vivo in genetically obese mice. Moreover, many of these genes are regulated by insulin.
For example, a strong positive correlation exists between elevated PAI-1 levels and the degree of hyperinsulinemia in obesity, and we have shown directly that insulin stimulates expression of the PAI-1 gene in adipocytes in vitro and in vivo. These observations not only implicate insulin itself in the increase in PAI-1 levels but also raise the possibility that PAI-1 may be regulated by a pathway that does not become insulin resistant. Our data also support this hypothesis. For example, we showed that insulin continues to induce PAI-1 gene expression in metabolically insulin-resistant ob/ob mice and in insulin-resistant 3T3-L1 adipocytes. Moreover, we have evidence that glucose transport and PAI-1 gene expression are mediated by different insulin signaling.
These observations suggest that the compensatory hyperinsulinemia often associated with insulin-resistant states directly contributes to elevated PAI-1 levels. These findings provide a potential mechanism for the abnormal increases in genes associated with risk for cardiovascular disease in obesity, non--insulin-dependent diabetes mellitus, and polycystic ovary disease.

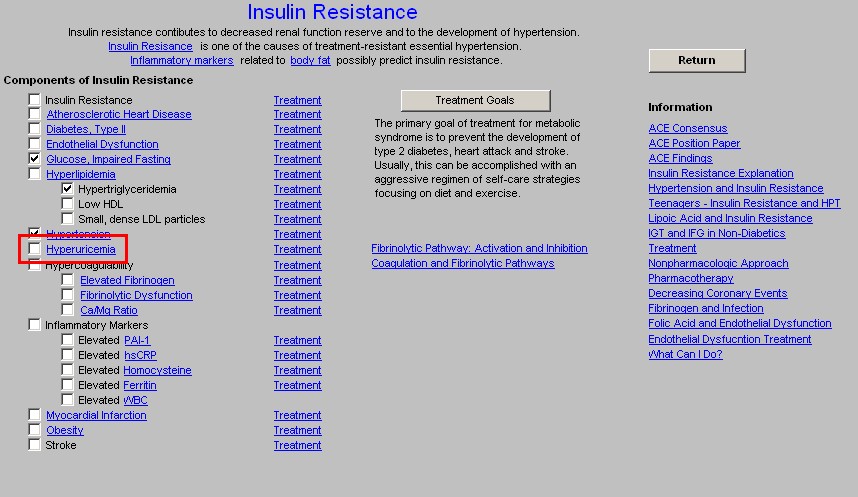
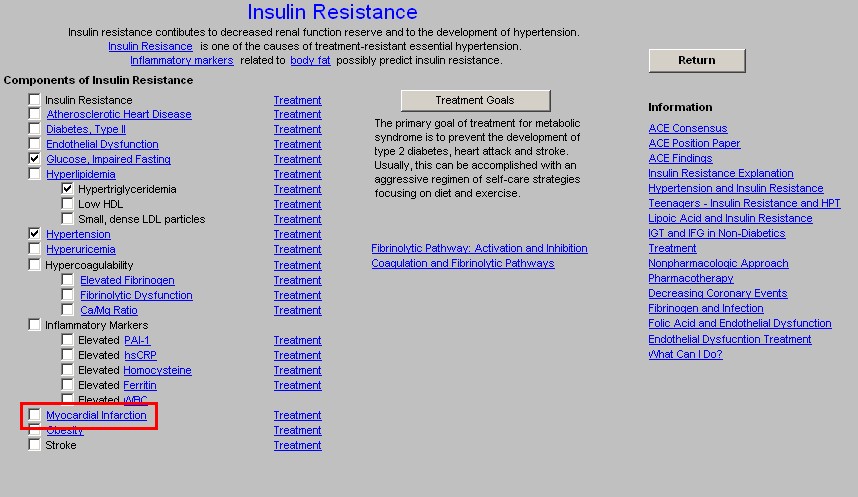
There are three columns on the Insulin Resistance Template
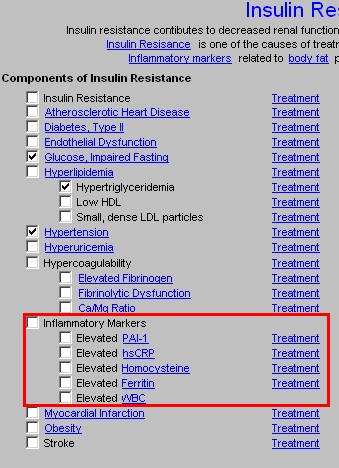
Column 1 –
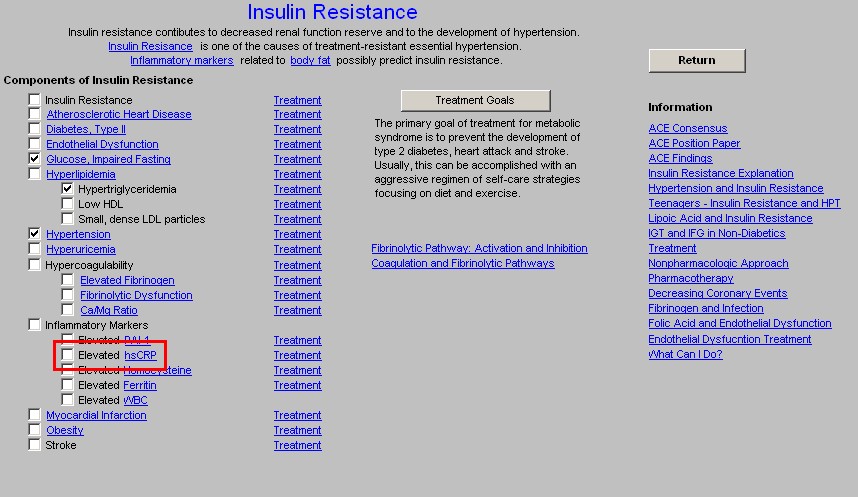
Components of Insulin Resistance
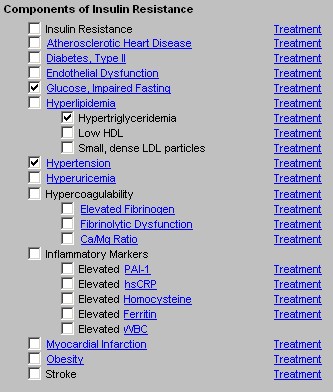
How the Insulin Resistance template works:
- This column lists the elements of Insulin Resistance. In a parallel column, there is a list of Treatments for each of these elements.
- There are check boxes beside each element where it can be documented that this patient manifests the element.
- When the name of an insulin resistance component is in blue, a link to a document or pop-up is present which gives information about that component.
- The information is accessed by clicking on the name of the component.
- When the parallel Treatment button is clicked, a pop-up is displayed which gives the treatment for that component of insulin resistance.
- All of the measures, medications and/or methods of treatment which are documented by clicking in the boxes on the various treatment pop-ups are collected and summarized on the SynX Plan template.
- It will be noticed that the treatment or treatments for one component of the insulin resistance syndrome often treats another component as well.
The following illustrates how the Insulin Resistance Template works.
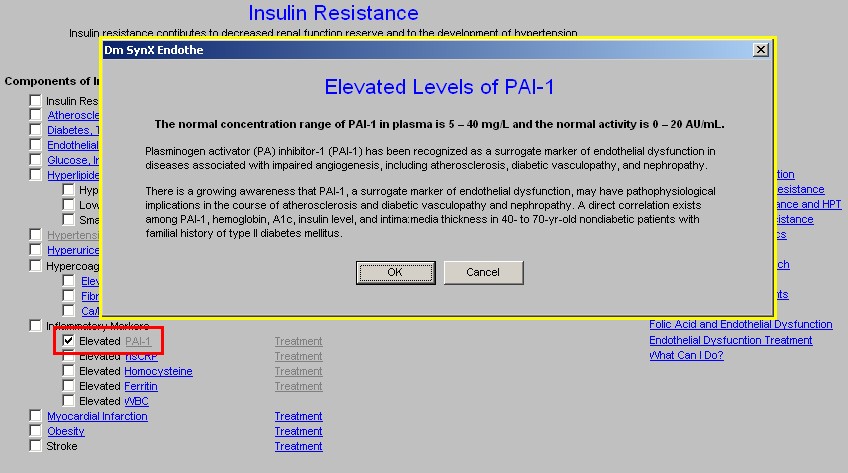
If a patient has an elevated plasminogen activator inhibitor 1 (PAI-1) level, you would check the box beside PAI-1 under Components of the Insulin Resistance Syndrome.
This will launch a description of PAI-1, if you need to review this description later, you can click on the PAI-1 name (hyperlink) and re-launch the description of PAI-1.
You would then click on the Treatment button parallel to the PAI-1 name.
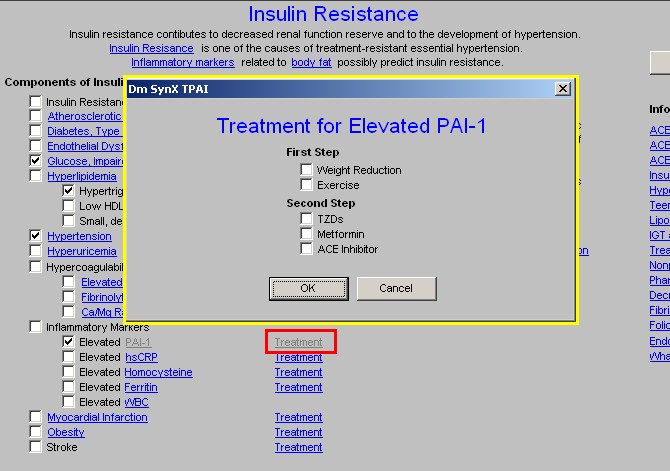
Any of the treatment recommendations, selected on this PAI-1 Treatment pop-up will automatically be noted on the Synx Plan template. This same pattern would be repeated for as many elements of the Insulin Resistance Syndrome as are present in this patient.
The following is an explanation of the components of the Insulin Resistance Syndrome.
The format of this material is:
- The name of the component of the Insulin Resistance Syndrome is given.
- These are discussed in the order of their appearance on the template.
- After the name, the material displayed when the name of the component is clicked, appears.
- After the descriptive material is given, the treatment recommendations are presented on pop-up screens. These screens are triggered by the Treatment hyperlinks that are aligned with each descriptive component.
- Remember, any treatment recommendations which you check on these pop-ups will appear on the SynX Template.
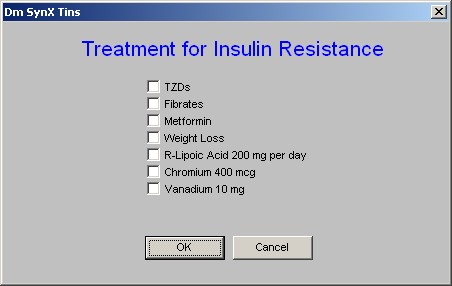
Insulin Resistance – there is no descriptive information for this component as the entire suite of templates is about insulin resistance.
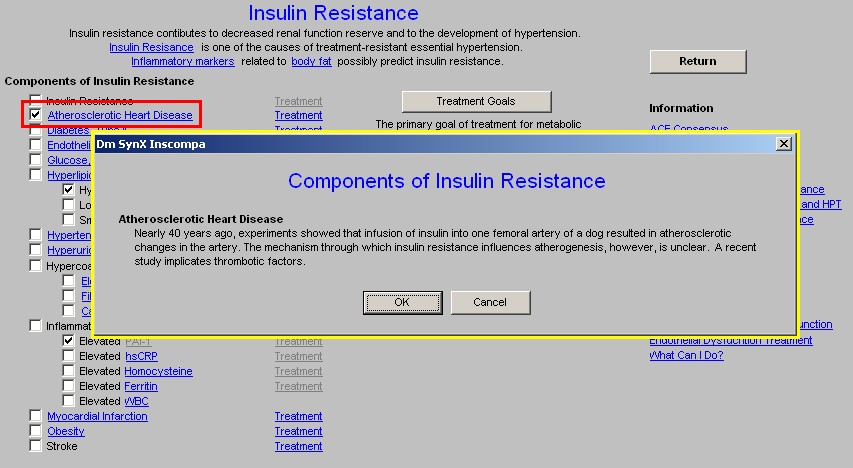
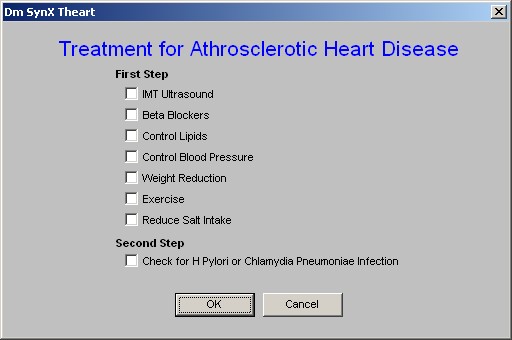
Atherosclerotic Heart Disease
Nearly 40 years ago, experiments showed that infusion of insulin into one femoral artery of a dog resulted in atherosclerotic changes in the artery. The mechanism through which insulin resistance influences atherogenesis, however, is unclear. A recent study implicates thrombotic factors.
Type 2 Diabetes
Type 2 diabetes is the condition most obviously linked to insulin resistance. Compensatory hyperinsulinemia helps maintain normal glucose levels--often for decades--before overt diabetes develops. Eventually the beta cells of the pancreas are unable to overcome insulin resistance through hypersecretion. Glucose levels rise, and a diagnosis of diabetes can be made. Patients with type 2 diabetes remain hyperinsulinemic until they are in an advanced stage of disease. Only in severe cases, in patients with fasting glucose levels above 180 to 198 mg/dL, are low plasma levels of insulin present.
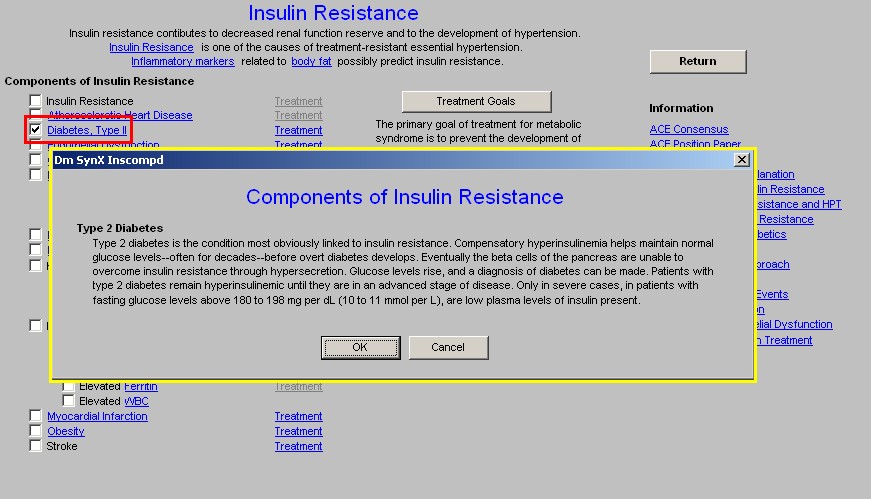
Treatment of Diabetes Type 2
Clicking on the Treatment button parallel to Diabetes Type 2 launches the Master Diabetes Template
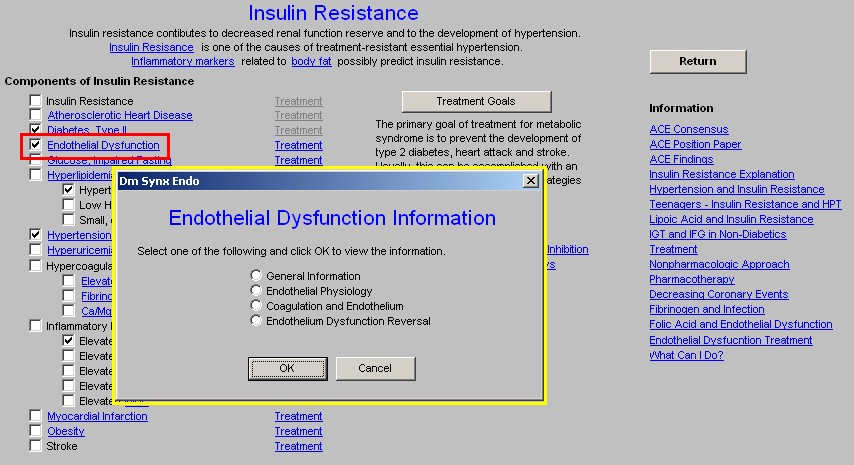
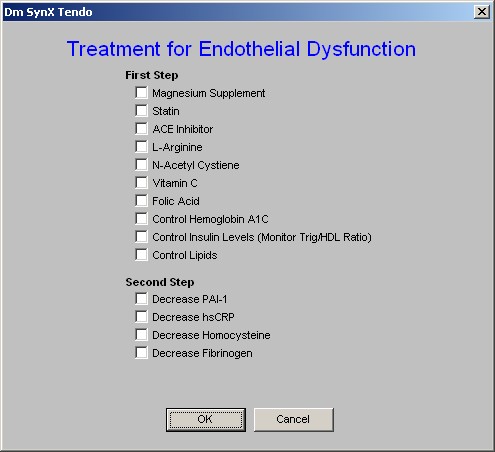
When the link attached to this component’s name is accessed, a template is launched which has four documents for provider education. They are:
- Endothelial Dysfunction: A Marker of Atherosclerotic Risk
- Endothelial Cells in Physiology and in the Pathophysiology of Vascular Disorders
- Endothelial Cells Role in Coagulation
- Monitoring the Reversal of Endothelia Cell Dysfunction
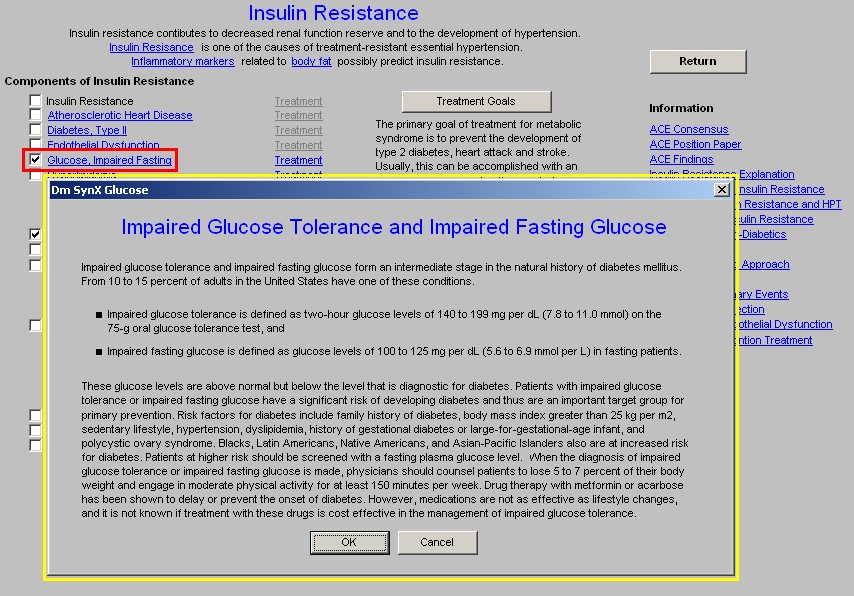
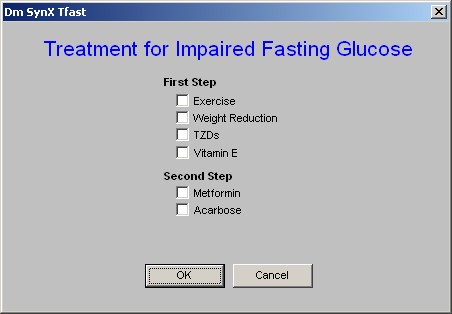
- Glucose, Impaired Fasting
Impaired Glucose Tolerance and Impaired Fasting Glucose
Impaired glucose tolerance and impaired fasting glucose form an intermediate stage in the natural history of diabetes mellitus. From 10 to 15 percent of adults in the United States have one of these conditions.
- Impaired glucose tolerance is defined as two-hour glucose levels of 140 to 199 mg/dL on the 75-g oral glucose tolerance test, and
- Impaired fasting glucose is defined as glucose levels of 100 to 125 mg/dL in fasting patients.
These glucose levels are above normal but below the level that is diagnostic for diabetes. Patients with impaired glucose tolerance or impaired fasting glucose have a significant risk of developing diabetes and thus are an important target group for primary prevention. Risk factors for diabetes include family history of diabetes, body mass index greater than 30, sedentary lifestyle, hypertension, dyslipidemia, history of gestational diabetes or large-for-gestational-age infant, and polycystic ovary syndrome.
Blacks, Latin Americans, Native Americans, and Asian-Pacific Islanders also are at increased risk for diabetes. Patients at higher risk should be screened with a fasting plasma glucose level.
When the diagnosis of impaired glucose tolerance or impaired fasting glucose is made, physicians should counsel patients to lose 5 to 7 percent of their body weight and engage in moderate physical activity for at least 150 minutes per week. Drug therapy with metformin or acarbose has been shown to delay or prevent the onset of diabetes. However, medications are not as effective as lifestyle changes, and it is not known if treatment with these drugs is cost effective in the management of impaired glucose tolerance.
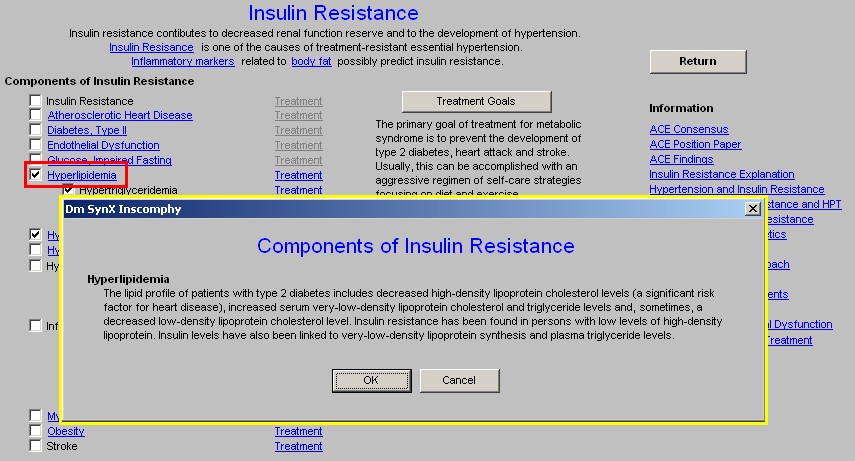
Hyperlipidemia
The lipid profile of patients with type 2 diabetes includes decreased high-density lipoprotein cholesterol levels (a significant risk factor for heart disease), increased serum very-low-density lipoprotein cholesterol and triglyceride levels and, sometimes, a decreased low-density lipoprotein cholesterol level. Insulin resistance has been found in persons with low levels of high-density lipoprotein. Insulin levels have also been linked to very-low-density lipoprotein synthesis and plasma triglyceride levels.
Treatment of Hyperlipidemia
Clicking the Treatment Button on Hyperlipidemia launches the Master Lipid Template
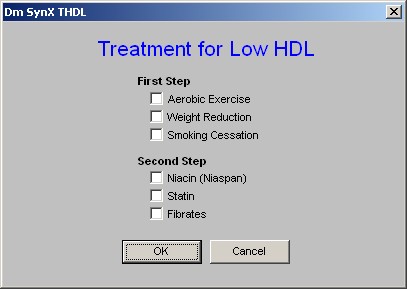
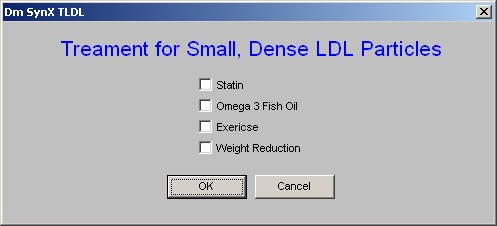
There are then treatment suggestions given for three elements of the dyslipidemia which is associated with the Metabolic Syndrome: High triglycerides, low HDL, high small, dense LDL.
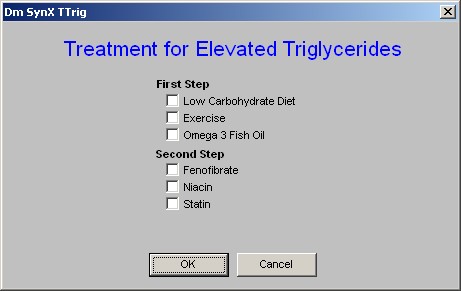
- Small, dense LDL particles
Hypertension
One half of patients with essential hypertension are insulin resistant and hyperinsulinemic. There is evidence that blood pressure is linked to the degree of insulin resistance. Exactly how insulin resistance influences blood pressure, however, is controversial. Furthermore, a strong relationship between insulin resistance and blood pressure may not occur in many patients, especially black patients.
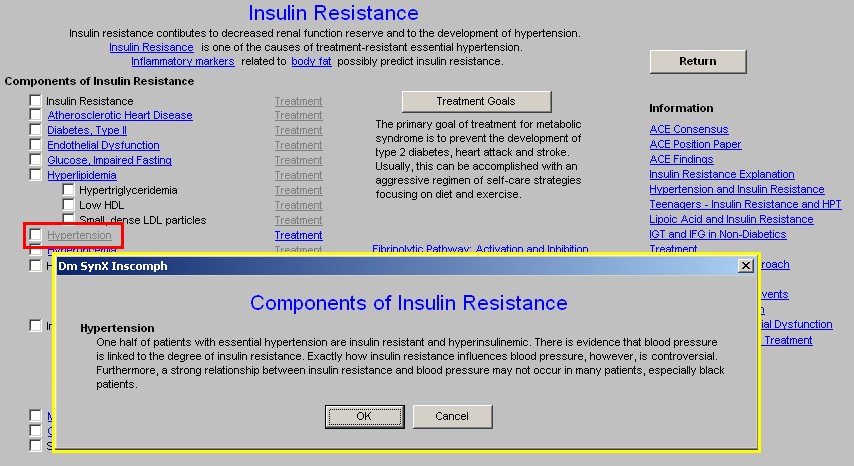
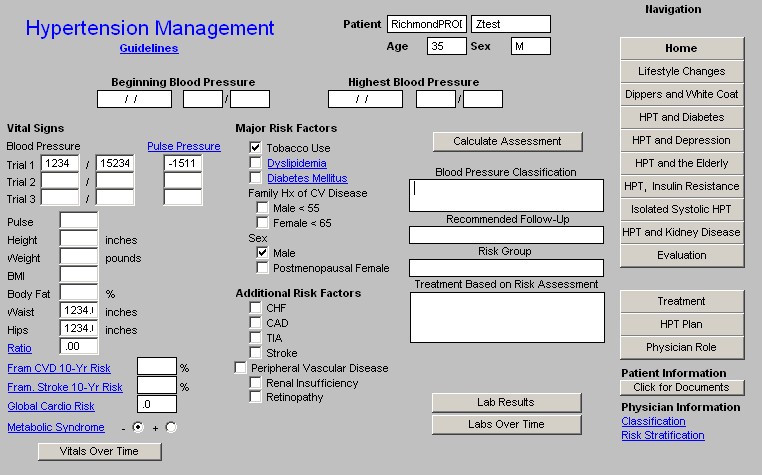
Treatment for Hypertension
This button launches the Master Hypertension Template. It should be remembered that Insulin Resistance is one of the main causes of treatment resistant hypertension. Sometimes, blood pressure control can be improved by treating the insulin resistance along with the blood pressure.
The information displayed by clicking on Hyperuricemia is a document entitled “Uric Acid,: Archives of Internal Medicine July 2004;164:1546-1551.
Treatment for Hyperuricemia
Avoid the following foods
Liver, kidney, anchovies, sardines, herring, mussels, bacon, codfish, scallops, trout, haddock, veal, venison, turkey, alcoholic beverages
Eat the following foods occasionally
Asparagus, beef, bouillon, chicken, crab, duck, ham, kidney beans, lentils, lima beans, mushrooms, lobster, oysters, pork, shrimp, spinach
Eat the following foods without limitation
Carbonated beverages, coffee, fruits, breads, grains, macaroni, cheese, eggs, milk products, sugar, tomatoes and green vegetables (including lettuce and excluding vegetables listed above)
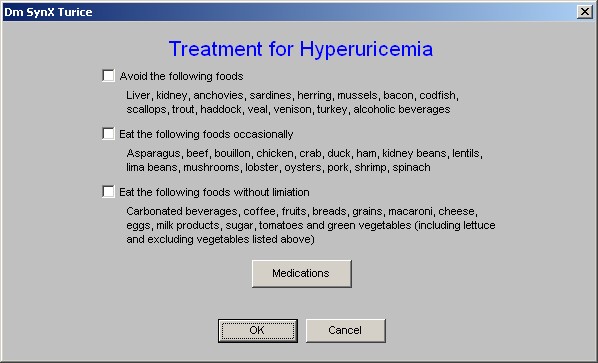
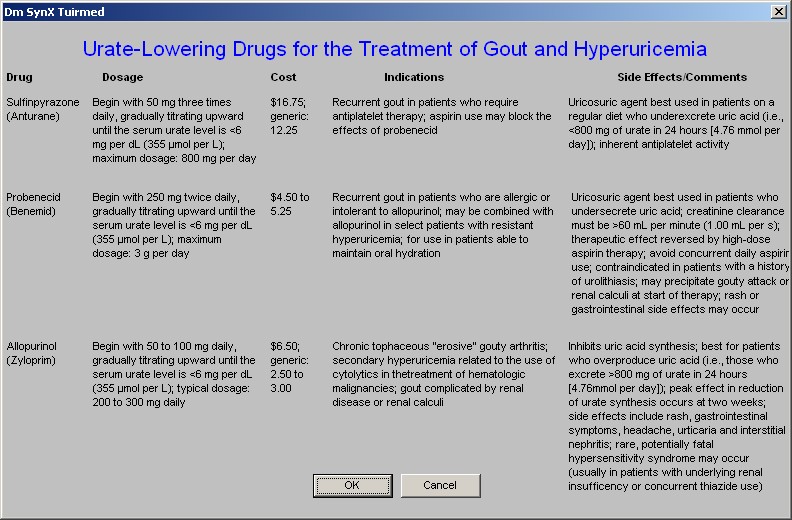
When the Treatment button is depressed parallel to Hyperuricemia, the above pop-up is launched. In addition to the above information, there is a button the pop-up entitled, Medications. When this button is depressed. a pop-up appears which is entitled:
Urate-Lowering Drugs for the Treatment of Gout and Hyperuricemia
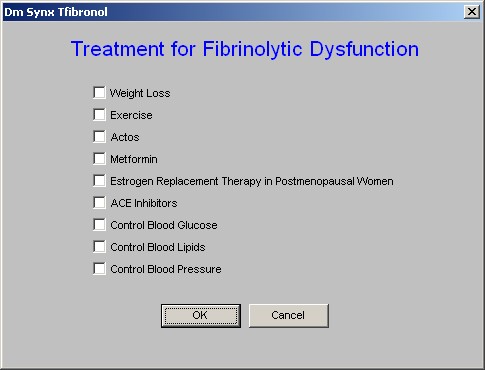
- Hypercoagulability – there is no document associated with this component, but the three elements of hypercoagulability related to the Metabolic Syndrome – Elevated Fibriongen, Fibrinolytic Dysfunction and Ca++/Mg++ Ratio – all have explanatory documents attached to them.
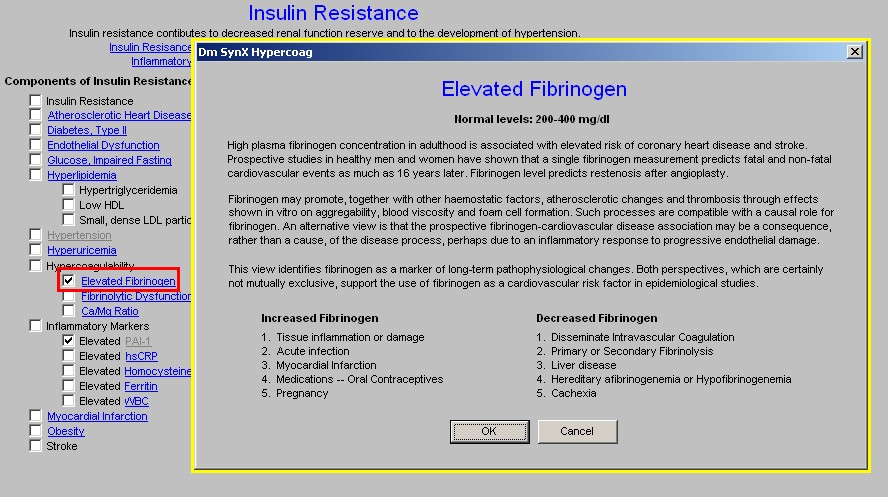
Elevated Fibrinogen
Normal levels: 200-400 mg/dl
High plasma fibrinogen concentration in adulthood is associated with elevated risk of coronary heart disease and stroke. Prospective studies in healthy men and women have shown that a single fibrinogen measurement predicts fatal and non-fatal cardiovascular events as much as 16 years later. Fibrinogen level predicts restenosis after angioplasty.
Fibrinogen may promote, together with other haemostatic factors, atherosclerotic changes and thrombosis through effects shown in vitro on aggregability, blood viscosity and foam cell formation. Such processes are compatible with a causal role for fibrinogen. An alternative view is that the prospective fibrinogen-cardiovascular disease association may be a consequence, rather than a cause, of the disease process, perhaps due to an inflammatory response to progressive endothelial damage.
This view identifies fibrinogen as a marker of long-term pathophysiological changes. Both perspectives, which are certainly not mutually exclusive, support the use of fibrinogen as a cardiovascular risk factor in epidemiological studies.
Increased Fibrinogen
- Tissue inflammation or damage
- Acute infection
- Myocardial Infarction
- Medications -- Oral Contraceptives
- Pregnancy
Decreased Fibrinogen
- Disseminate Intravascular Coagulation
- Primary or Secondary Fibrinolysis
- Liver disease
- Hereditary afibrinogenemia or Hypofibrinogenemia
- Cachexia
The informational document attached to this component in part states:
Fibrinolytic Dysfunction
The human body must maintain a delicate balance between blood clotting and blood not clotting. Thrombosis is the pathological results of excessive blood clotting. Hemorrhaging is the pathological result of excessive fibrinolysis. The abnormalities associated with the metabolic syndrome, particularly insulin resistance and hyperinsulinism, enhance the propensity for acute thrombosis through interfering with fibrinolysis.
Thrombotic risk which is higher in diabetes type 2, impaired fasting glucose and impaired glucose tolerance may be mediated more by impaired fibrinolysis than by hypercoagulability.
Among people with the metabolic syndrome, atherosclerosis is increased and fibrinolytic function is abnormal. Specifically, plasminogen activator inhibitor-1 (PAI-1) is increased among type 2 diabetic patients and predicts myocardial infarction and stroke.
Also, elevated endogenous tissue-type plasminogen activator (tPA) predicts mortality and myocardial infarction, and is elevated in response to endogenous fibrinolytic inhibitors such as PAI-1. It is likely, therefore, that high plasma concentrations of PAI-1 and tPA reflect a state of fibrinolytic dysfunction.
Fibrinolytic dysfunction increases the propensity to develop arterial thrombosis, which in turn may increase CVD in people with the metabolic syndrome. This hypothesis is supported by the recent observations that diabetes and abdominal obesity are risk predictors of both venous thrombosis and occlusive arterial disease. Although prior studies have documented that markers of fibrinolysis are abnormal in people with the metabolic syndrome, it remains unclear whether these abnormalities reflect fibrinolytic dysfunction or are merely a response to vascular injury or plaque turnover. Functional tests of fibrinolysis are available; however, because of the complexity involved in performing them, they have not been performed on a large scale.
Fibrinolysis is suppressed by increased plasma levels of:
- Plasminogen-activator inhibitor type 1 (PAI-1)
- Factor VII
- Fibrinogen
- von Willebrand factor
High concentrations of tissue plasminogen activator (t-PA) and d-dimer (a measure of fibrinolysis) increase the risk of myocardial infarction.
Thromboembolic Diseases
Because of the linkages among high triglyceride, low HDL-C, reduced glucose tolerance, hyperinsulinemia, obesity, as well as increased coagulation and reduced fibrinolytic capacity, it has been suggested that a suitable name for this clustering of coronary risk factors might be athero-thrombogenic syndrome, thereby indicating that both atherosclerosis and thrombosis contribute to its development.
Blood coagulation that takes place in blood vessels gives rise to thromboses and emboli that can result in heart attacks and strokes. Since it has long been known that Ca enhances the coagulation process while Mg inhibits it, the high Ca/Mg ratio in the Metabolic Syndrome X is a likely factor in its thromboembolic complications. It was shown first in experimental Mg deficient animals that their platelets are more sensitive to aggregation caused by thrombin, an effect that was deemed important in initiating clinical vascular lesions and thrombotic complications.
Whether low Mg levels were induced by diabetes or alcoholism, or in normal subjects on a low enough diet to cause hypomagnesemia, Mg infusions or oral Mg supplements at 400 mg/day inhibited increased platelet aggregation on exposure to various aggregating agents. Mg also inhibited thrombin-induced Ca influx in platelets and stimulated synthesis of potent natural antiaggregating substances. Alcoholics' predilection to high blood pressure and atherosclerotic CVD has been attributed to their Mg loss.
Mg can inhibit platelet aggregation, an effect that is increased by insulin. Decreased intracellular ionic platelet Mg has been suggested as a possible indicator for thrombosis and atherogenesis.
- Inflammatory Markers – there are five currently used inflammatory markers for insulin resistance and some of its effects. They are listed here.
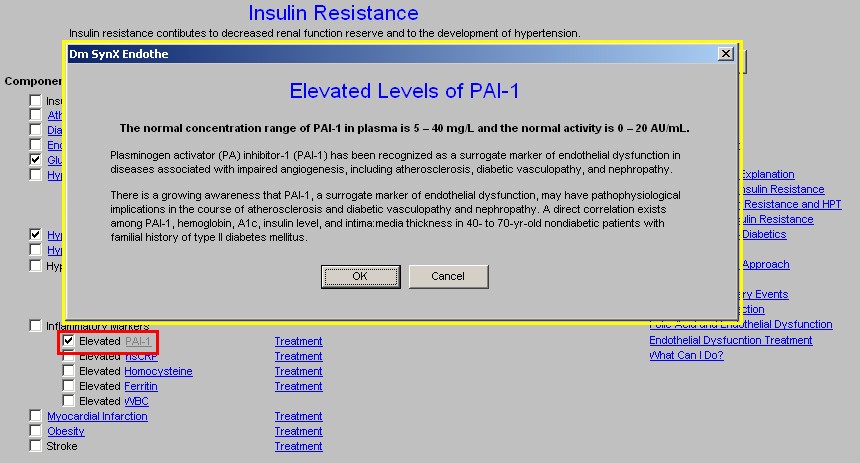
Elevated Levels of PAI-1
The normal concentration range of PAI-1 in plasma is 5 – 40 mg/L and the normal activity is 0 – 20 AU/mL.
Plasminogen activator (PA) inhibitor-1 (PAI-1) has been recognized as a surrogate marker of endothelial dysfunction in diseases associated with impaired angiogenesis, including atherosclerosis, diabetic vasculopathy, and nephropathy.
There is a growing awareness that PAI-1, a surrogate marker of endothelial dysfunction, may have pathophysiological implications in the course of atherosclerosis and diabetic vasculopathy and nephropathy. A direct correlation exists among PAI-1, hemoglobin, A1c, insulin level, and intima:media thickness in 40- to 70-yr-old nondiabetic patients with familial history of type II diabetes mellitus.
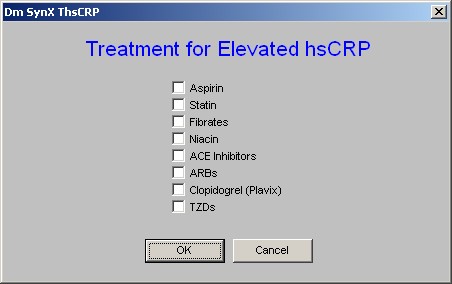
hsCRP
Clinical Use of hs-CRP
- Hs-CRP may add prognostic information in patients at intermediate risk (eg. Framingham Risk Score between 10-20%)
- Hs-CRP may also add prognostic information in patients with Acute Coronary Syndromes.
- Hs-CRP should be measured twice (averaging results) in the patient's usual state of health, preferably 2 weeks apart, and should be reported as mg/L.
- Measurements of hs-CRP should be postponed when the patient has an acute illness, (eg. Cold, arthritis flare-up).
- Hs-CRP testing does not require a fasting specimen.
- Hs-CRP results are interpreted according to 3 risk groups:
- Low risk (<1.0 mg/L0
- Intermediate risk (1.0-3.0 mg/L)
- High risk (>3.0 mg/L).
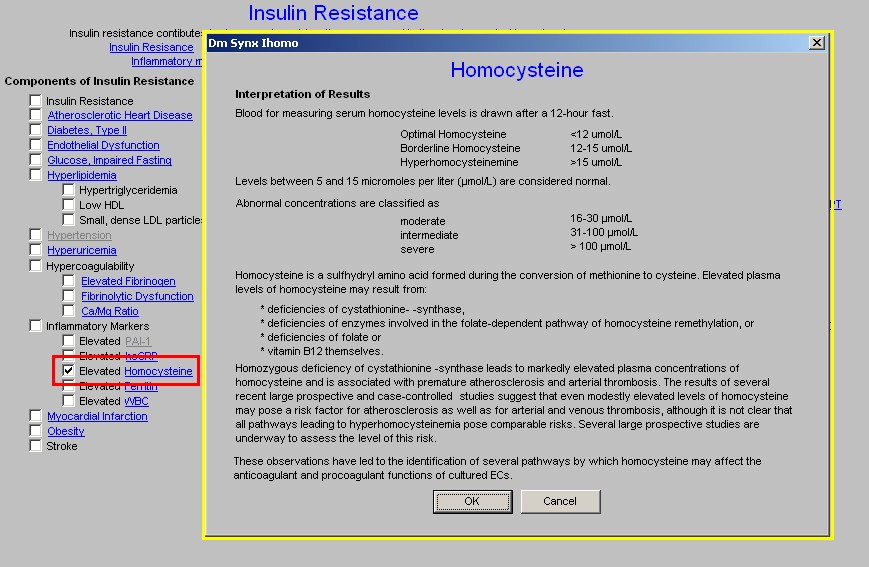
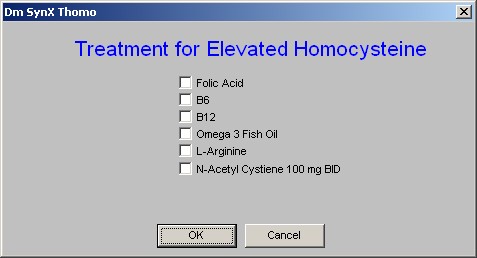
Homocysteine
Interpretation of Results -- Blood for measuring serum homocysteine levels is drawn after a 12-hour fast.
- Optimal Homocysteine <12 umol/L
- Borderline Homocysteine 12-15 umol/L
- Hyperhomocysteinemine >15 umol/L
Levels between 5 and 15 micromoles per liter (µmol/L) are considered normal.
Abnormal concentrations are classified as
- moderate 6-30 µmol/L
- intermediate 31-100 µmol/L
- severe > 100 µmol/L
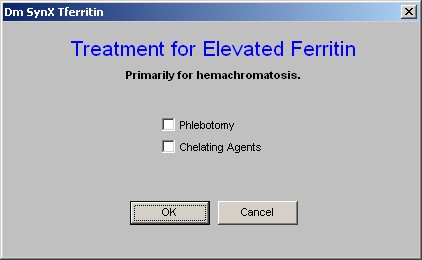
“Serum Ferritin and Risk of the Metabolic Syndrome in U.S. Adults,” Diabetes Care 27:2422-2428, 2004
Ferritin levels are abnormal in the following:
Men:
serum iron >190 µg/dl
serum ferritin >300 µg/l
transferrin saturation >60%
Women:
serum iron >175 µg/dl
serum ferritin >200 µg/l
transferrin saturation >60%)
Elevated iron stores were positively associated with the prevalence of the metabolic syndrome and with insulin resistance.
There is increasing evidence that moderately elevated body iron stores, below levels commonly found in genetic hemochromatosis, may be associated with adverse health outcomes. Elevated serum ferritin levels independently predicted incident type 2 diabetes in prospective studies in apparently healthy men and women. In cross-sectional studies, elevated ferritin levels have been associated with hypertension, dyslipidemia, elevated fasting insulin and blood glucose, and central adiposity. The association between elevated iron stores and the metabolic syndrome, however, has been less well explored.
21. Elevated WBC
High White Blood Cell Count Is Associated With a Worsening of Insulin Sensitivity and Predicts the Development of Type 2 Diabetes Diabetes 51:455-461, 2002
Chronic low-grade inflammation may be involved in the pathogenesis of insulin resistance and type 2 diabetes. We examined whether a high white blood cell count (WBC), a marker of inflammation, predicts a worsening of insulin action, insulin secretory function, and the development of type 2 diabetes in Pima Indians.
Activation of the immune system and inflammation may be detected by an increase in a number of markers, including:
- white blood cell count (WBC)
- cytokine
- plasminogen activator inhibitor-1 (PAI-1) concentrations.
Why are WBC and insulin sensitivity associated?
One possible explanation is that both a higher WBC and insulin resistance reflect an underlying activation of the immune system. It was shown, for instance, that interleukin-6 (IL-6), a potent white blood cell differentiation factor that is produced mostly in adipose tissue is associated with insulin resistance.
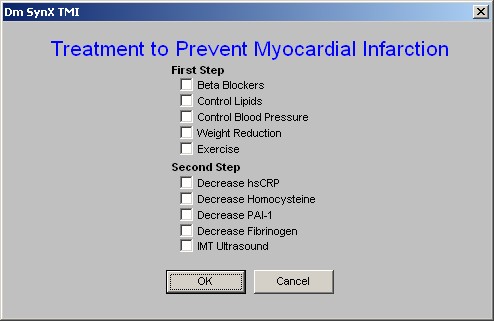
22. Myocardial Infarction
Myocardial Infarction
PAI-1 and vWF are released acutely during the first hours of STEMI with a poor prognosis. A dramatic release of these 2 biomarkers occurs in the vast majority of patients developing heart failure and in those dying within the first month. An important finding of the present study is that PAI-1 release is the strongest independent predictor of death at 30 days in this data set.
23. Obesity
Obesity
Many persons with one or more of the conditions listed above are obese. Obesity is a component of the syndrome, but it promotes insulin resistance rather than resulting from it. Weight loss can improve insulin sensitivity and reduce insulin levels.
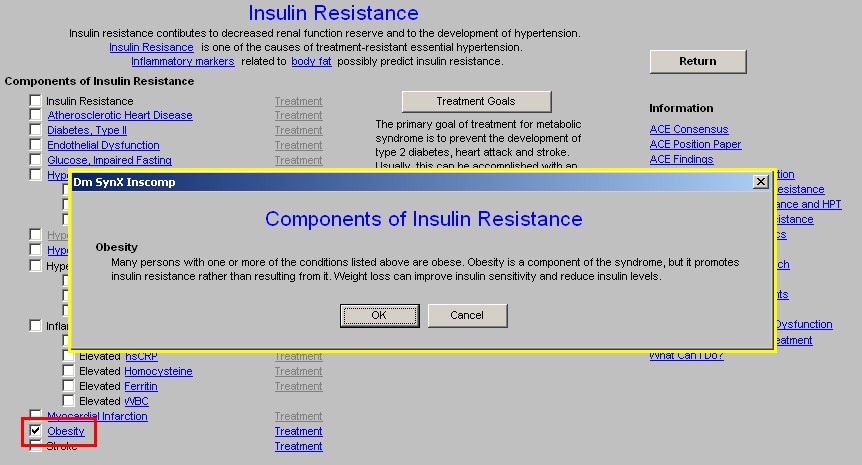
The Treatment button aligned with Obesity launches the Master Weight Management Template
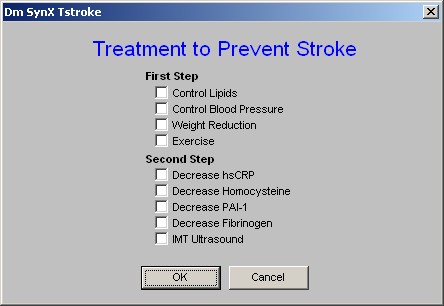
24. Stroke – There is no educational material associated with stroke.
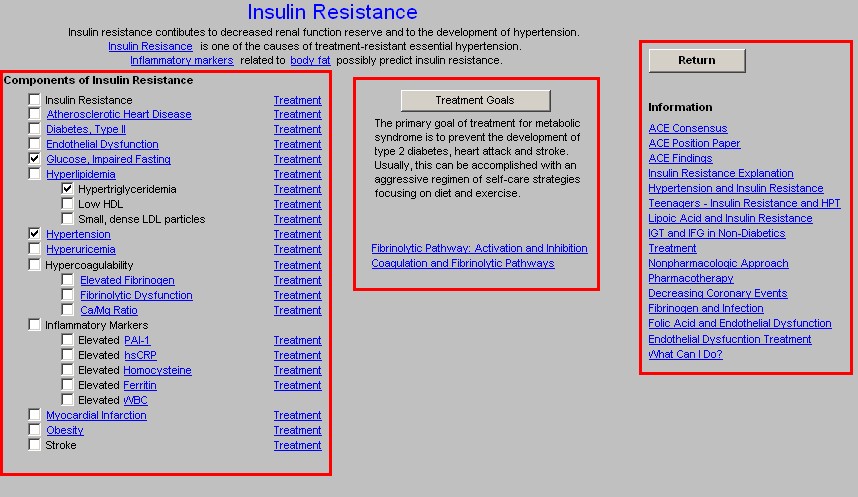
Column 2
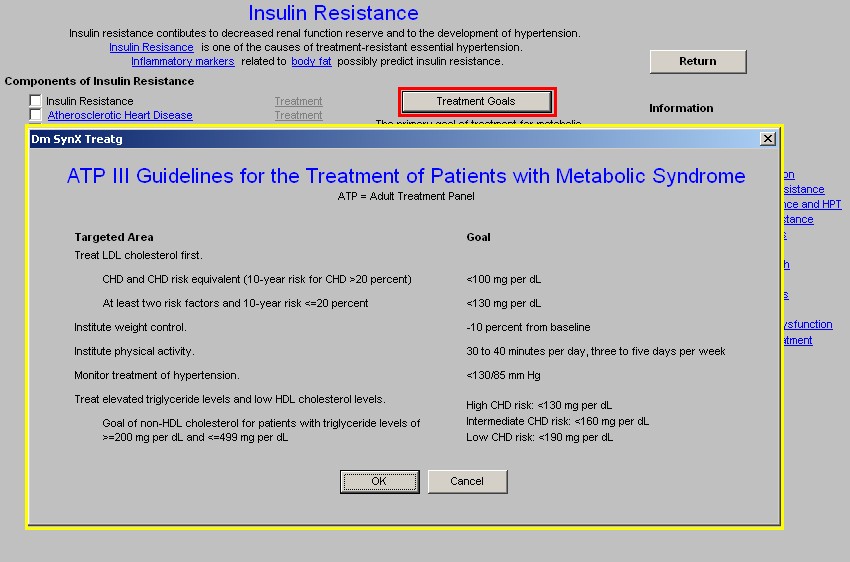
There is a button entitled Treatment Goals which when depressed displays the following information:
ATP II Guidelines for the Treatment of Patients with Metabolic Syndrome
ATP = Adult Treatment Panel
Beneath this button is the statement:
“The primary goal of treatment for metabolic syndrome is to prevent the development of type 2 diabetes, heart attack and stroke. Usually, this can be accomplished with an aggressive regimen of self-care strategies focusing on diet and exercise.”
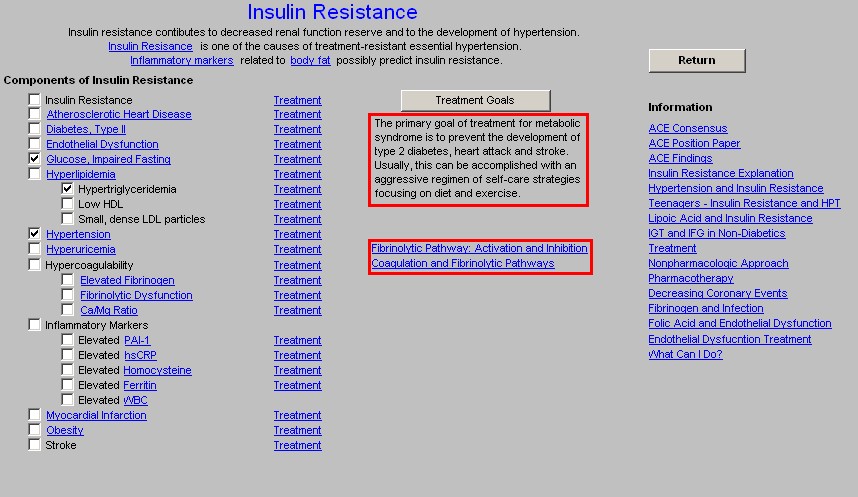
Beneath this statement are two buttons entitled:
- Fibrinolytic pathway: Activation and inhibition
- Coagulation and Fibrinolytic Pathways
These enable the provider to review the place of action of each of the elements of the insulin resistance and to review the coagulation system which is so intimately involved in atherosclerosis, endothelial dysfunction and the metabolic syndrome.
The Fibrinolytic Pathway presents the following diagram
Fibrinolytic Pathway: Activation and Inhibition
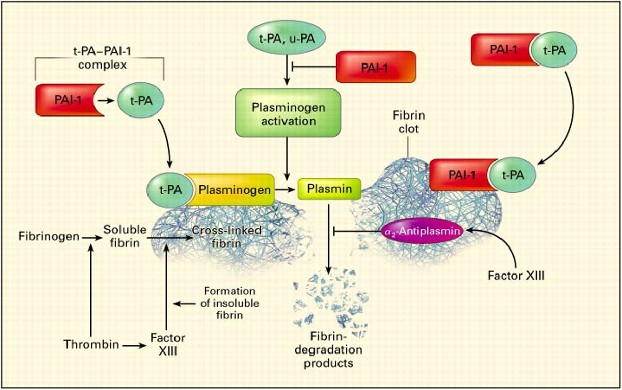
Tissue plasminogen activator (t-PA) circulates in plasma as a complex with plasminogen-activator inhibitor type 1 (PAI-1) in a 1:1 ratio. The fibrin clot provides the surface on which the reactions occur. Plasminogen is activated by t-PA or urinary-type plasminogen activator (u-PA).
Plasminogen, t-PA, and fibrin form a ternary complex that promotes the formation of plasmin and the subsequent lysis of cross-linked fibrin into low-molecular-weight fragments (fibrin-degradation products). PAI-1 also binds to fibrin and, when bound, retains its inhibitory activity against t-PA. 2-Antiplasmin is cross-linked to fibrin by factor XIII.
The Coagulation and Fibrinolytic Pathways presents the follow diagram
Coagulation and Fibrinolytic Pathways
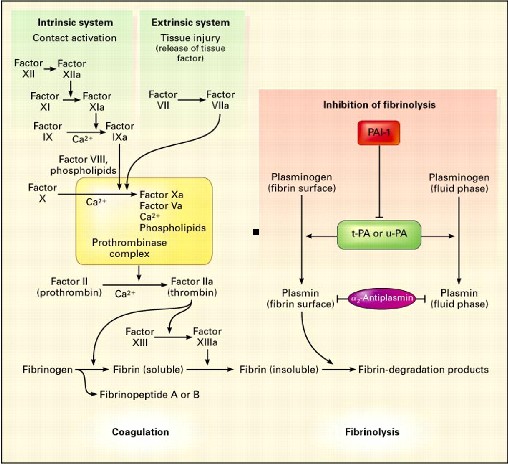
The main coagulation reactions are divided into the intrinsic and extrinsic systems. Activation of factor XII on contact with a negatively charged surface initiates the intrinsic coagulation system. (The activated form of the factor is indicated by "a.") The extrinsic coagulation system induces the formation of a complex composed of factor VII and tissue factor, which is released after tissue injury. Some of these reactions depend on calcium ions. Thrombin is formed by an enzyme complex called prothrombinase, composed of factor X, factor V, negatively charged phospholipids, and calcium ions. Intrinsic and extrinsic activation of the coagulation cascade leads to the generation of thrombin, the activation of fibrinogen, the release of fibrinopeptides, the formation of soluble fibrin, and finally, the formation of factor XIII-mediated, cross-linked, insoluble fibrin.
The main fibrinolytic reactions involve the inhibition of fibrinolysis by plasminogen-activator inhibitor type 1 (PAI-1) and 2-antiplasmin. Fibrinolysis is initiated by:
- tissue plasminogen activator (t-PA),
- urinary-type plasminogen activator (u-PA), and
- plasmin.
Plasmin bound to the surface of fibrin initiates the lysis of insoluble, cross-linked fibrin, with the subsequent generation of fibrin-degradation products. Plasmin bound to the surface of fibrin is better protected from inhibition by 2-antiplasmin than is plasmin generated in the fluid phase.
Column 3 –
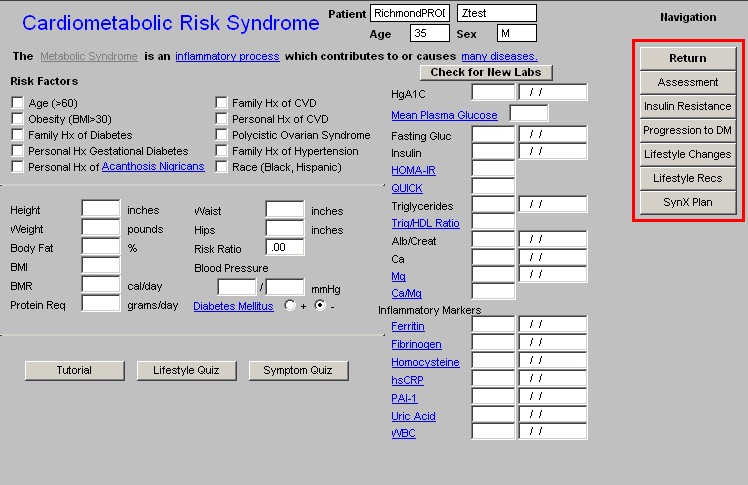
Return – this Navigation button takes you back to the Master Metabolic Syndrome template
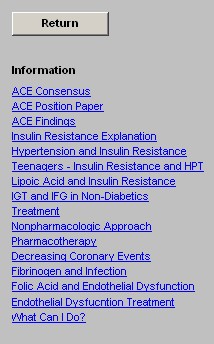
The following articles are then listed and are printable for review:
Progression to Type 2 Diabetes Template
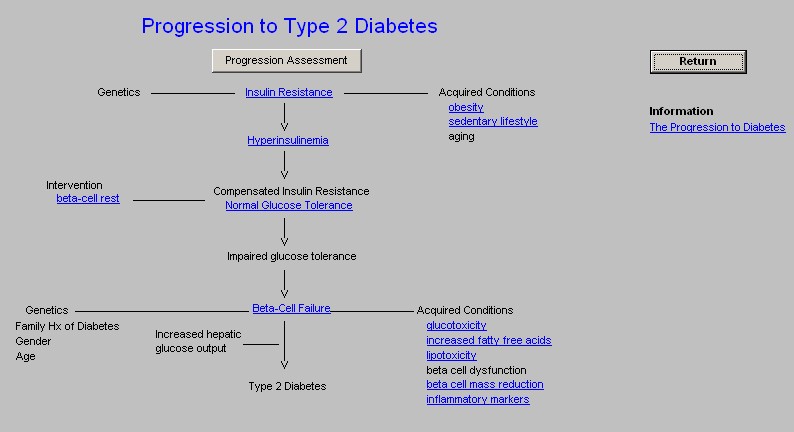
Remember the statement on the Insulin Resistance Template, “The primary goal of treatment for metabolic syndrome is to prevent the development of type 2 diabetes, heart attack and stroke. Usually, this can be accomplished with an aggressive regimen of self-care strategies focusing on diet and exercise”
The first function on this template is a button which is entitled
“Progression Assessment.”
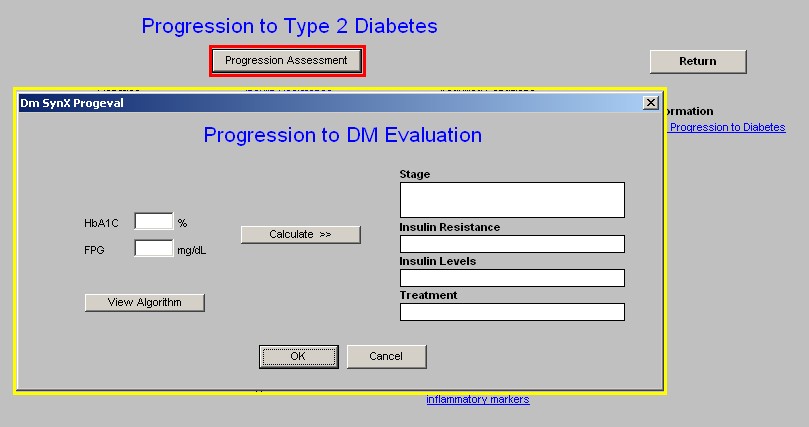
When this button is depressed it displays a Progression to DM Evaluation.”
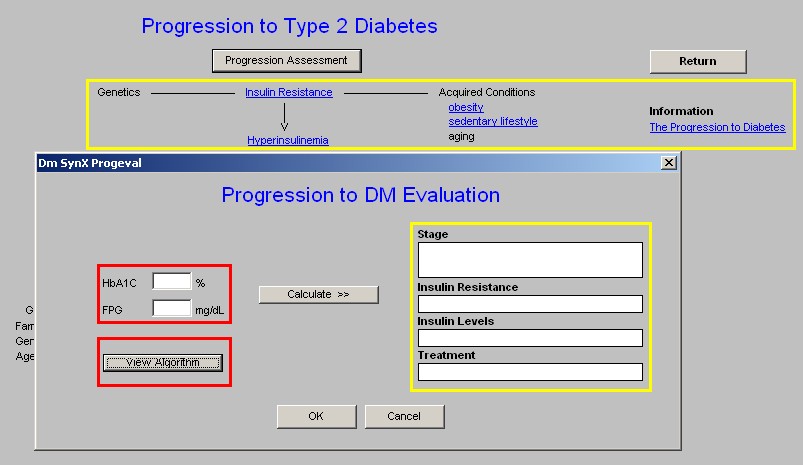
If the patient has had a Hbg A1c and/or a fasting plasma glucose, the values will be automatically displayed in the appropriate box on the pop-up.
When you depress the button entitled “Calculate,” the following data will be displayed:
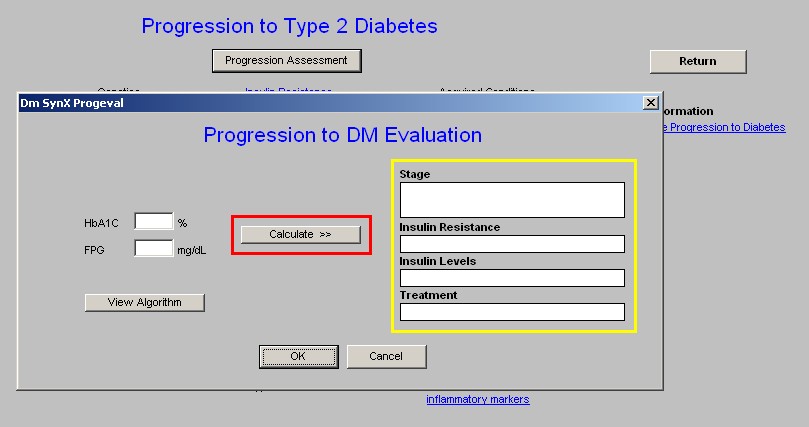
At the left lower part of the pop-up there is a button entitled Algorithm. When launched this button produces a table which gives the five stages of progression to Diabetes and the degree of insulin resistance and the plasma insulin levels associated with each stage.
Progression of Type 2 Diabetes
Beneath this there is a diagram which shows the progression from Insulin resistance to Type 2 diabetes.
This diagram shows the progression from inactivity lifestyle to obesity, to insulin resistance, to hyperinsulinism, to beta cell fatigue, to hyperglycemia, to beta cell exhaustion to Diabetes Mellitus Type 2.
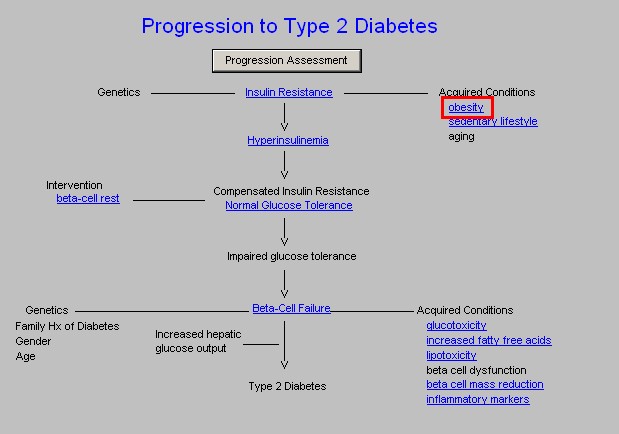
NOTE: Words in blue (hyperlinks) have documents attached to them.
The following terms have documents which are launched by clicking on them:
Insulin Resistance – this is the first step toward diabetes mellitus.
Obesity -- when the link attached to the acquired condition of obesity is launched, it displays the following information:
Fat Cells Promote illness
- Fat cells which are considered “ectopic,” in the liver, muscle and around the abdomen, produce numerous hormones.
- These hormones promote inflammation, increased coagulation, hypertension and insulin resistance.
- All of these processes are reversed by weight loss.
- Dysfunctional Fat Cells – fat cells which do not respond to insulin. These cells become very active metabolically producing adipocytokines which are harmful to the body with one exception.
- Dysfunctional Fat Cell Syndrome – insulin resistance, hypertension, accelerated atherosclerosis in type 2 diabetes and obesity, which are all the result of ectopic (visceral) fat accumulation with the production of adipocytokines.
- Can dysfunctional fat cells be converted to healthy adipocytes? Yes. Thiazolidnediones (Actos and Avadia) decrease intra-abdominal fat and increase subcutaneous fat increasing insulin sensitivity and decreasing bad adipocytokines. In the case of Triazolidnediones, total body fat actually may increase but visceral fat decreases which is good and subcutaneous fat increases which is not bad.
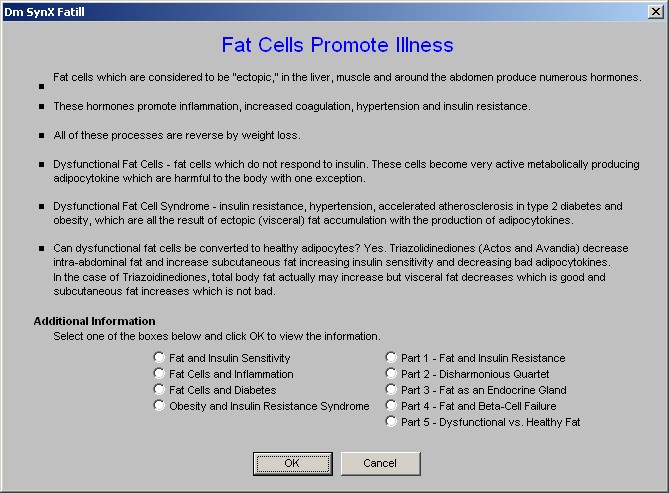
Beneath these statements about fat on the pop-up is the heading Additional Information. By following the directions given on the template, the following articles are accessible. These articles are part of a larger study on the metabolic effect of fat which is excellent.
By selecting a box and clicking OK the nine documents can be displayed.
Beta Cell Rest
At any time prior to this point in the Progression to DM from Insulin Resistance, the reversal of the acquired conditions of obesity and/or sedentary lifestyle can stop or significantly slow the progression to Type 2 Diabetes.
There is another way of stopping this Progression at this point and it is called Beta Cell Rest. The stress placed on the Beta Cell by the increasing demand for insulin production, can lead to the exhaustion of the beta cells and the development of diabetes mellitus type 2.
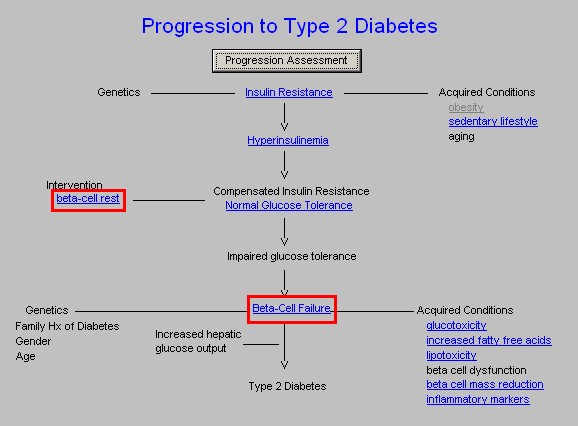
Beta Cell Rest -- reduction in secretory demands imposed on B-cells by chronic insulin resistance
Beta Cell Failure
In the absence of Beta Cell Rest and/or modification of the acquired conditions which propels the progression from insulin resistance to type 2 diabetes, the patient develops Impaired Glucose Tolerance, which if not treated with lifestyle modifications and beta cell rest will result in Beta Cell Failure.
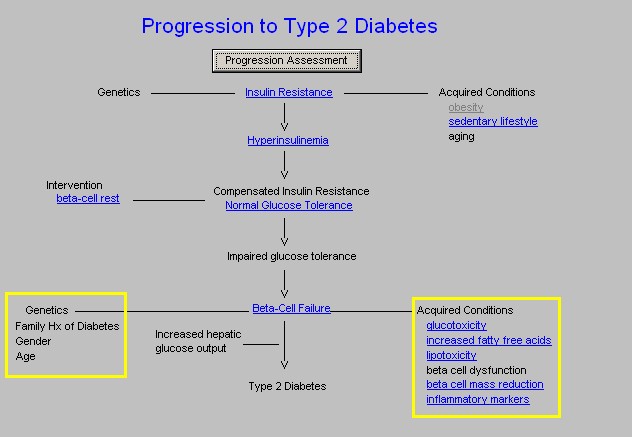
It is at this point that additional acquired conditions such as:
- Glucotoxicity – there is an information document linked here.
- Increase Free Fatty Acids – there is an information document linked here.
- Lipotoxicity – there is an information document linked here.
- Beta Cell Dysfunction
- Beta Cell Mass Reduction – there is an information document linked here.
- Inflammatory Markers – there is an information document linked here.
Along with:
Genetics, including a family history of type 2 diabetes, gender and age coalesce to add to the burden of increased hepatic glucose output to produce type 2 diabetes.
Remember the statement on the Insulin Resistance Template, “The primary goal of treatment for metabolic syndrome is to prevent the development of type 2 diabetes, heart attack and stroke. Usually, this can be accomplished with an aggressive regimen of self-care strategies focusing on diet and exercise”
The reminder of the Progression to Diabetes type 2 is that diabetes is progressive. Neither glucose tolerance nor diabetes is static; it is either getting better due to lifestyle changes and aggressive treatment, or it is getting worse. And, it should never be forgotten that the best way to treat diabetes is not to get it.
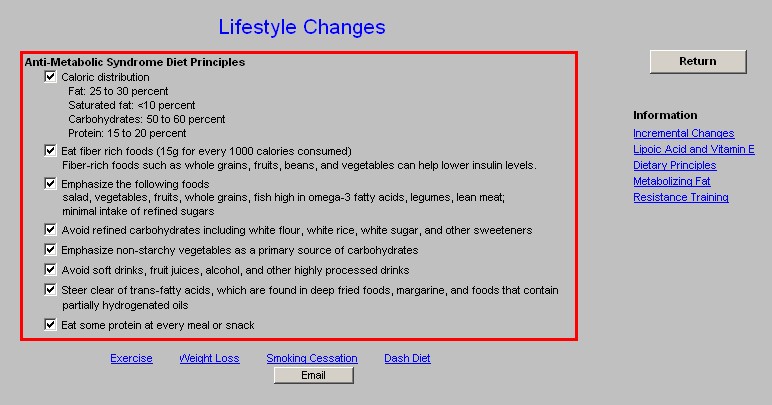
Lifestyle Changes Template
It can not be overemphasized that lifestyle changes are the key to the treatment of the metabolic syndrome. And, without persistence in lifestyle changes, pharmacological changes can NOT prevent the development of diabetes.
The following dietary principles appear on the template.
Note: These principles are auto checked when the template is opened and they also automatically appear on the follow-up note as instruction to the patient.
Anti-Metabolic Syndrome Diet Principles
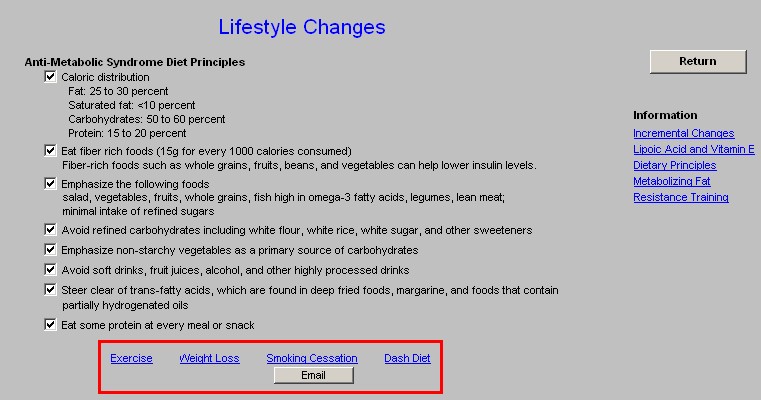
At the bottom of the template are links to:
- Exercise
- Weight Loss
- Smoking Cessation with an electronic tickler e-mail function attached.
- DASH Diet – Dietary Approach to Stop Hypertension
These are THE keys to success in the prevention and the treatment of the Metabolic Syndrome and diabetes.
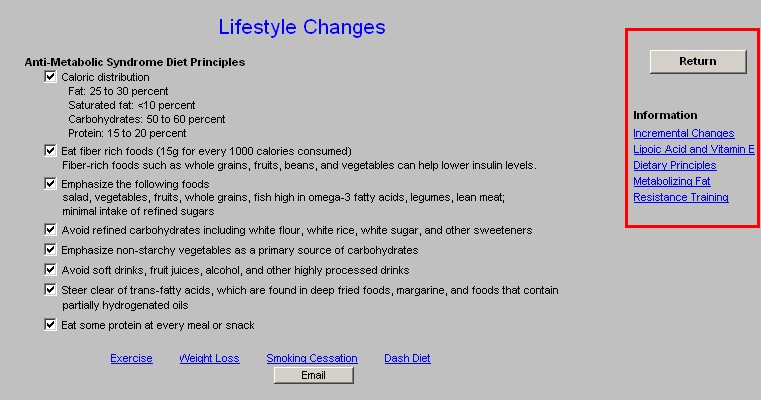
At the right hand side of the template there is a Navigation button which takes you back to the Master Metabolic Syndrome Template
There are also five educational documents which can be read and/or printed.
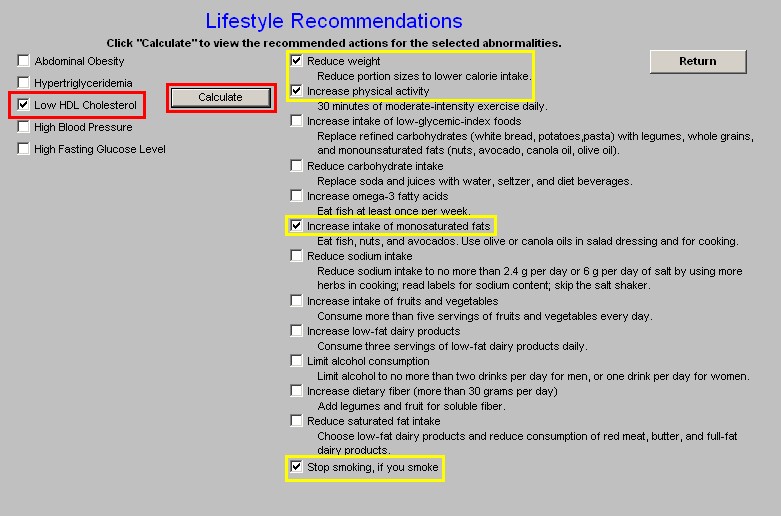
Lifestyle Recommendations Template
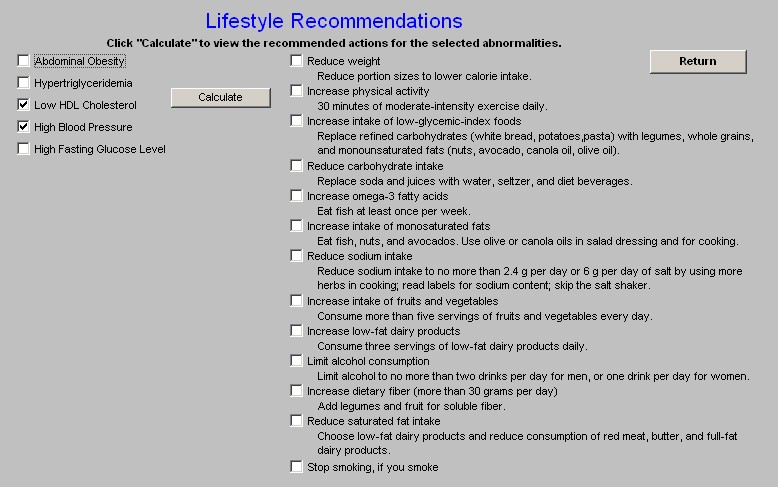
The results of this template’s use will appear on the Follow-up note which will be printed and given to the patient at the end of the encounter in which the Metabolic Syndrome Suite of templates is used.
Here is how this template works:
In the left hand column, there are five abnormalities which will be automatically populated from other data in the patient’s electronic medical record. These abnormalities are:
- Abdominal Obesity
- Hypertriglyceridemia
- Low HDL Cholesterol
- High Blood Pressure
- High Fasting Blood Glucose
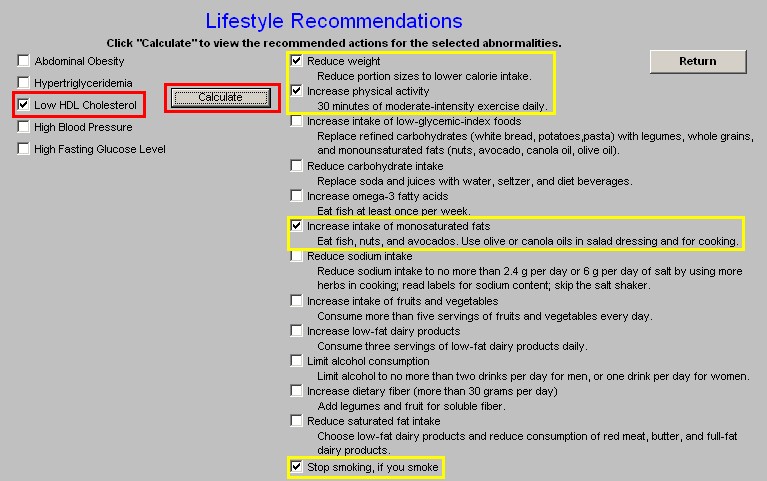
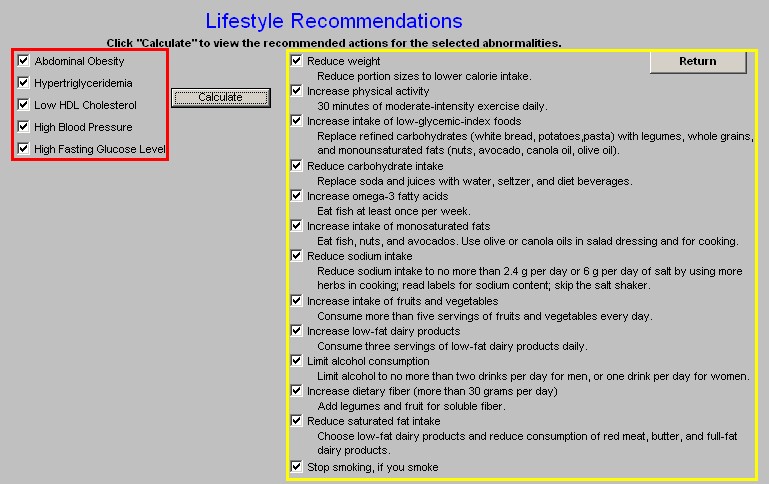
At the right hand side of the template is a list of 13 Recommendations:
- Reduce Weight -- Reduce portion sizes to lower calorie intake.
- Increase Physical Activity -- 30 minutes of moderate-intensity exercise daily.
- Increase intake of low-glycemic-index foods -- Replace refined carbohydrates (white bread, potatoes, pasta) with legumes, whole grains, and monounsaturated fats (nuts, avocado, canola oil, olive oil).
- Reduce carbohydrate intake -- Replace soda and juices with water, seltzer, and diet beverages.
- Increase omega 3 fatty acids -- Eat fish at least once per week.
- Increase intake of monosaturated fats -- Eat fish, nuts, and avocados. Use olive or canola oils in salad dressing and for cooking.
- Reduce sodium intake -- Reduce sodium intake to no more than 2.4 g per day or 6 g per day of salt by using more herbs in cooking; read labels for sodium content; skip the salt shaker.
- Increase intake of fruits and vegetables -- Consume more than five servings of fruits and vegetables every day.
- Increase low-fat dairy products -- Consume three servings of low-fat dairy products daily.
- Limit alcohol consumption -- Limit alcohol to no more than two drinks per day for men, or one drink per day for women.
- Increase dietary fiber (more than 30 grams per day) -- Add legumes and fruit for soluble fiber.
- Reduce saturated fat intake -- Choose low-fat dairy products and reduce consumption of red meat, butter, and full-fat dairy products.
- Stop smoking, if you smoke
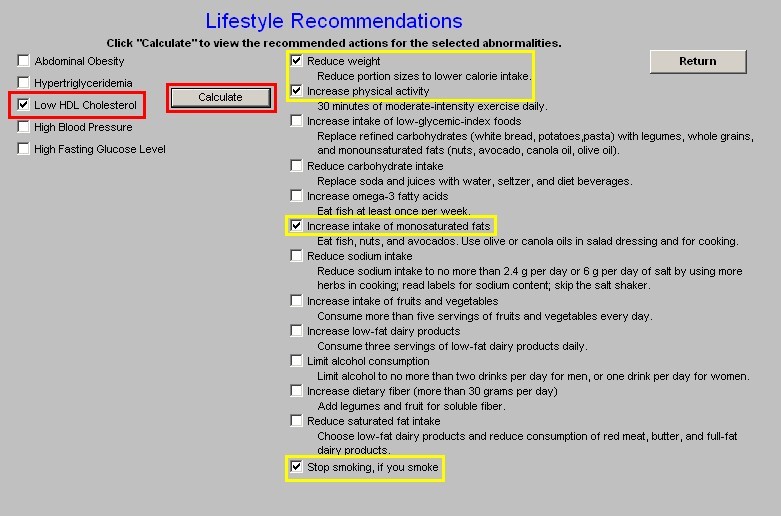
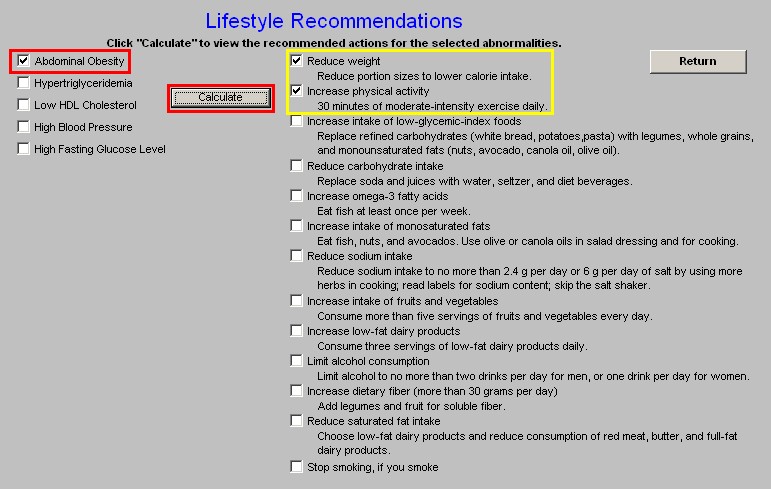
Between the Abnormalities and the Recommendations is a button entitled Calculate. When this button is depressed, all of the treatment recommendations which are appropriate for the abnormalities present in this patient will be marked with a check.
All of these recommendations will then appear on the Follow-up note which will be given to the patient. These recommendations will help the patient take charge of his/her own care by modifying the behaviors indicated.
Note: It should be noted that these recommendations are cumulative. For instance if the patient only has abdominal obesity, it will be recommended that the patient reduce weight and increase physical activity. If hypertriglyceridemia is also an abnormality it will be recommended that the patient lose weight, increase physical activity, increase intake of low-glycemic index foods, reduce carbohydrate intake, increase omega 3 fatty acids and increase intake of monosaturated fats.
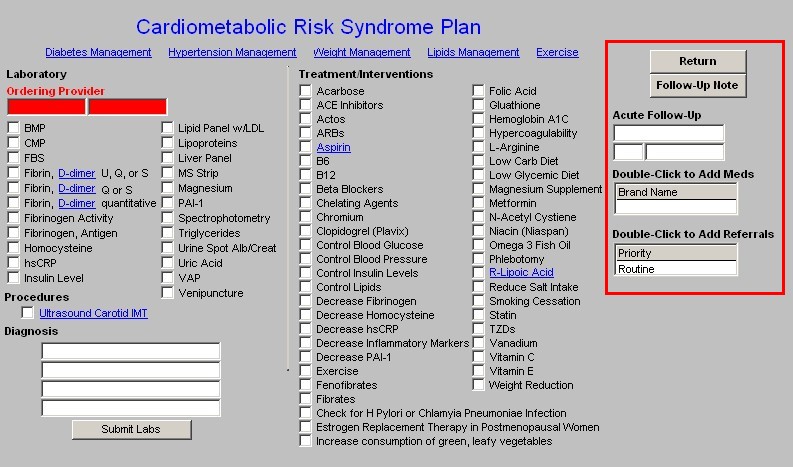
SynX Plan Template

The plan template brings all of the treatment recommendations together in one place. Across the top are links to the following:
- Diabetes Management
- Hypertension Management
- Weight Management
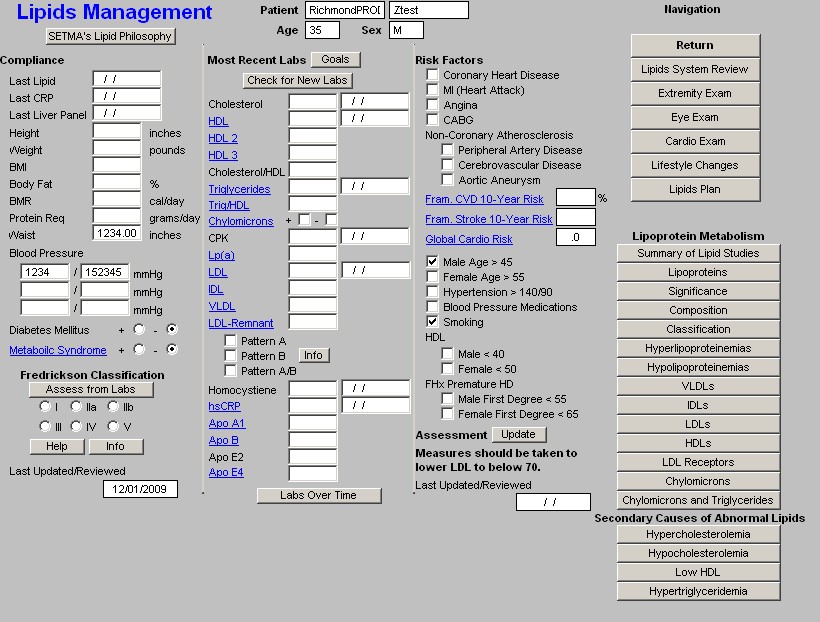
- Lipids Management
- Exercise
Each of these is an integral part of the treatment of the Metabolic Syndrome. At one time or another, the principles contained in each of these tools will be employed to treat the patient with the Metabolic Syndrome successfully.
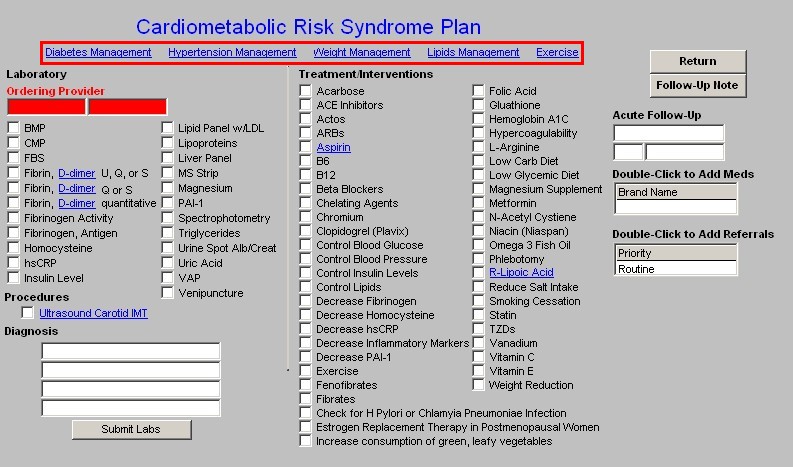
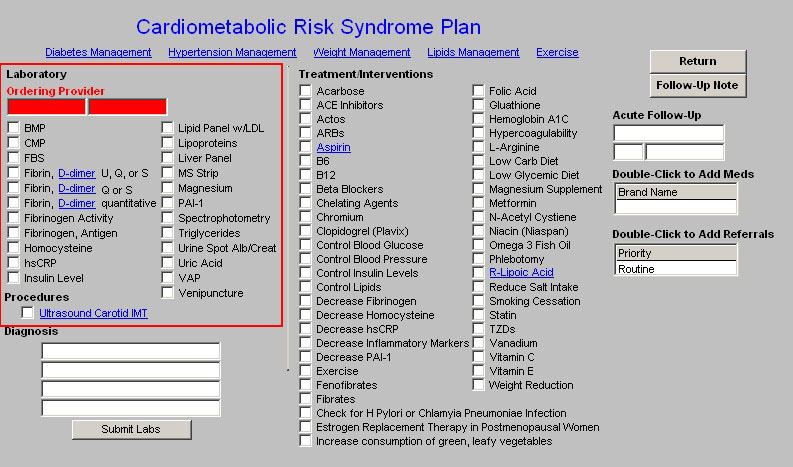
At the left of the column appears the laboratory tests which can be ordered and charge posted from the Metabolic Syndrome Plan Template.
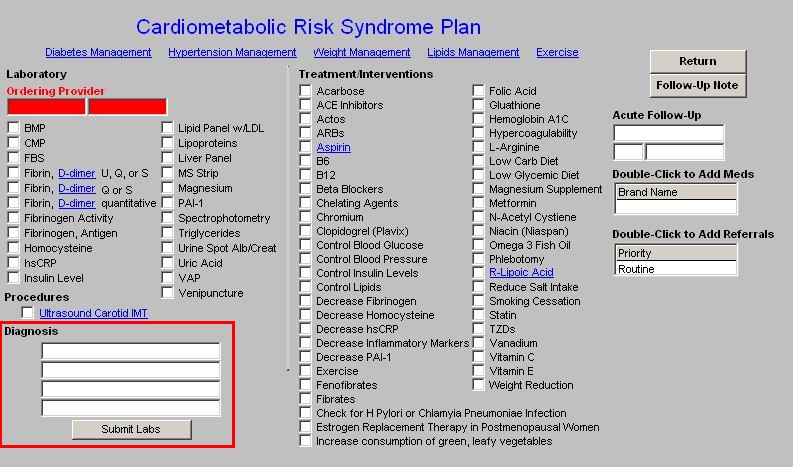
Beneath the Lab for ordering, are four Diagnoses boxes. The ICD-9 Pick list attached to the first box is only Metabolic Syndrome X. The other three have the full SETMA ICD-9 code list.
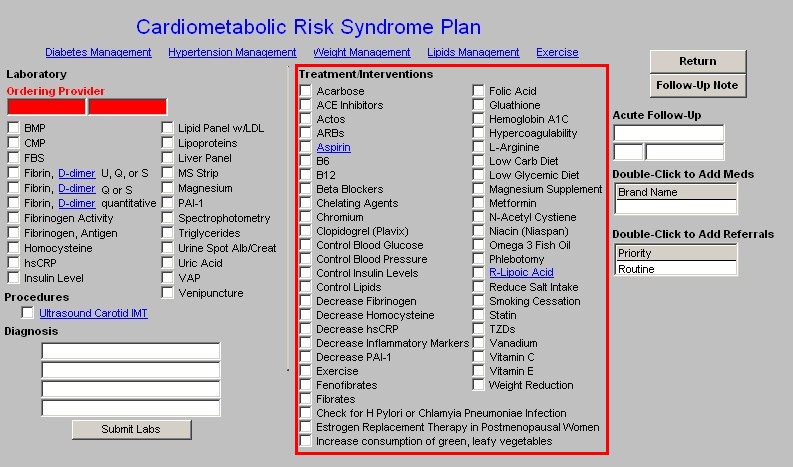
To the right are listed all of the recommendations which are on the Treatment pop-ups on the Insulin Resistance Template. Any of the treatment options which were marked there will appear here.
In the right hand column, the following functions are present:
- Return button which takes you back to the Master Metabolic Template
- Follow-Up Note button which generates the Follow-up note for the patient.
- Medication Module Link so as to add any medications recommended.
- Referral Link so as to send referrals.
The last step in successfully using the Metabolic Syndrome Template is to generate a follow up note which will be given to the patient at the end of the visit
|