|
Introduction
A. Preventive Care Measures
B. Clinical Performance Measures
C. Organizational Measures
D. Patient Experience Measures
E. Staff Satisfaction Measures
Addendum A
SETMA’s Major Initiative to Reduce Preventable Readmissions
| Description of: | Southeast Texas Medical Associates, LLP (SETMA) |
| Prepared by: | James L. Holly, MD, CEO, SETMA |
| Adjunct Professor, Family and Community Medicine |
| School of Medicine, UT Health Science Center San Antonio |
| Presented to: | Ed Wagner, MD, MPH, National Program Co-Director |
| Margaret Flinter, PhD, APRN, National Program Co-Director |
| Tom Bodenheimer, MD, MPH, National Advisory Committee Director |
Project Proposal -- Robert Wood Johnson Foundation national program-the Primary Care Team: Learning from Effective Ambulatory Practices (PCT-LEAP
The goal of the program is to identify and study about 30 high functioning primary care practices with interesting team models and use of staff (exemplar practices) in order to create tools and materials to help other primary care practices with transformation and improvement. A description of the program can be found on the RWJF website.
(SETMA)....was one of nearly 400 that were recommended by experts in primary care and your peers. Our National Advisory Committee has begun the work of drilling down to a final group of practices for site visits and to form a learning community aimed at sharing the collective knowledge and experience of the participating practices with others. We seek exemplar sites that have performance measurement programs in place that can help assess the impact of their innovations in the practice.
Our next step is to ask you to help us understand how you are measuring and using data on clinical quality, organizational performance, patient experience, and /or staff experience. From our initial conversation with you, it is likely you already are routinely collecting data in several of these categories. We would appreciate it if you would be willing to share any performance reports such as run charts, dashboards, or quality reports that you already collect for your own improvement work.
Introduction
This is our response to your request that we “help (you) understand how (SETMA is)...measuring and using data on clinical quality, organizational performance, patient experience, and /or staff experience.” After this introduction, I will address each of the five categories which you identified in your correspondence.
This presentation does not simply provide lists of numbers for quality metrics. It attempts to provide a context in which it is possible to sustain the measurement of quality metrics as both a “score card” for excellent care and also as a guideline for areas which need improvement. Without this context, it is impossible to understand SETMA’s use of quality metrics. It is as if quality metrics are a healthcare GPS, telling us where we are, where we want to go, the path to tale to get to our destination and an alert when we have achieved our goal.
A second overarching comment concerns the only Pay-for-Performance programs in which we participate:
- PQRS
- ePrescribing
- Blue Cross/Blue Shield Diabetes
Currently, we receive no additional payments for performance, although through the Medicare Advantage STARs program, the ACO Quality Metrics performance, Meaningful Use and Medical Home, we will soon be receiving more reimbursement based on quality performance. These comments apply to all five of your questions.
SETMA’s commitment to Primary Care is evidenced by my wife and I, with support from The SETMA Foundation and others, having endowing the Dr. & Mrs. James L. Holly Distinguished Professorship in Patient-Centered Medical Home at my school of medicine. This is an interdepartmental and interdisciplinary effort between the schools of nursing and medicine. My wife and I have also endowed a Distinguished Lectureship in PC-MH and have given the initial endowment for the establishment of The Primary Care Institute at the Health Science Center. It is our hope to establish a one year Post-Graduate Fellowship for Primary Care providers the year after they complete their residencies. The Fellowship would focus on practice management, healthcare transformation, public policy and the growth and development of primary care in a patient-centered environment. .
While most of the material on our website about SETMA is not peer-reviewed, several pieces are:
- Agency for Healthcare Research and Quality has published SETMA’s LESS Initiative (Lose weight, exercise, stop smoking) on their Innovation Exchange.
- SETMA received the HIMSS Davies Award in 2005
- Dr. Holly’s multiple presentations at HIMSS
- SETMA’s peer-reviewed Stories of Success was published by HIMSS in 2010.
- American Medical Association - Care Transitions Quality Metrics Application to Hospital Setting
- Diabetes Center of Excellence PI-CME - Glyco and Cardio PI-CME
- Diabetes Center of Excellence PI-CME -- Eldercare PI-CME
- Centers for Disease Control - Analyzing Cost Control for Medicare Recipients in the Medical Home Setting
The following is a link to my March 21, 2012 presentation entitled, The Future of Primary Care to the inaugural meeting of the University of Texas Health Science Center at San Antonio School of Medicine’s Chapter of the Primary Care Progress.
A Brief History of SETMA
Southeast Texas Medical Associates, LLP (SETMA) is a medium size multi-specialty practice in Beaumont, Texas which began using electronic health records in March, 1998. Shortly after that we determined that our “real” goal was “electronic patient management,” i.e., the leveraging of the power and capabilities of electronics to improve the quality of the care we provided to our patients. That history is well documented on our website at www.jameslhollymd.com where all of our electronic patient management tools are displayed.
In 2000, we began auditing and analyzing data including using statistical analysis to look beyond individual patients to assess the quality of our population wise. For diabetes, our mean HbA1c has improved from 7.54 in 2000 to 6.64 in 2011, and our standard deviation has improved from 1.98 in 2000 to 1.2 in 2011. Gradually, we realized that we wanted to do “real time” auditing and analysis of our care. In 2009, we adapted IBM’s Business Intelligence software, COGNOS, to healthcare. In that year, we began Public Reporting on over 200 quality metrics on our website.
- Tracking metrics one patient at a time
- Auditing metrics over panels and populations of patients
- Analyzing the audited data to find leverage points for improvement
- Public Reporting provider performance and transparently sharing with our patients that performance.
- Designing quality improvement initiatives based on these four steps.
A complete description and explanation of this Model of Care can be found here: Primary Care: The Future - Primary Care Progress (PCP)
In this process, SETMA, SETMA came to believe that the future of healthcare will be founded on four domains:
- Method -- The methodology of healthcare must be electronic patient management.
- Content -- The content and standards of healthcare delivery must be evidenced-based medicine.
- Structure -- The structure and organization of healthcare delivery must be patient-centered medical home.
- Compensation - The payment must be capitation with rewards for quality in both process and outcomes.
In this time, SETMA has become an NCQA Tier-Three Patient Centered Medical Home and a AACH accredited ambulatory care clinic, an AAACH Medical Home and the first multispecialty group to become an affiliate of Josllin Diabetes Center.. We document all patient care in the same data-base whether the patient is in the hospital, home heath, physical therapy, hospice, nursing home, clinic or emergency department and are supporting the development of a regional health information exchange.
SETMA’s approach to quality metrics and public reporting is driven by these assumptions:
- Quality metrics are not an end in themselves. Optimal health at optimal cost is the goal of quality care. Quality metrics are simply “sign posts along the way.” They give directions to health. And the metrics are like a healthcare “Global Positioning Service”: it tells you where you want to be; where you are, and how to get from here to there.
- The auditing of quality metrics gives providers a coordinate of where they are in the care of a patient or a population of patients.
- Statistical analytics are like coordinates along the way to the destination of optimal health at optimal cost. Ultimately, the goal will be measured by the well-being of patients, but the guide posts to that destination are given by the analysis of patient and patient-population data.
- There are different classes of quality metrics. No metric alone provides a granular portrait of the quality of care a patient receives, but all together, multiple sets of metrics can give an indication of whether the patient’s care is going in the right direction or not. Some of the categories of quality metrics are: access, outcome, patient experience, process, structure and costs of care.
- The collection of quality metrics should be incidental to the care patients are receiving and should not be the object of care. Consequently, the design of the data aggregation in the care process must be as non-intrusive as possible. Notwithstanding, the very act of collecting, aggregating and reporting data will tend to create a Hawthorne effect.
- The power of quality metrics, like the benefit of the GPS, is enhanced if the healthcare provider and the patient are able to know the coordinates while care is being received.
- Public reporting of quality metrics by provider name must not be a novelty in healthcare but must be the standard. Even with the acknowledgment of the Hawthorne effect, the improvement in healthcare outcomes achieved with public reporting is real.
- Quality metrics are not static. New research and improved models of care will require updating and modifying metrics.
SETMA currently tracks the following:
- 34 NCQA HEDIS measures;
- 14 NCQA Diabetes Recognition Metrics;
- 35 NQF-endorsed measures;
- 27 PQRS measures;
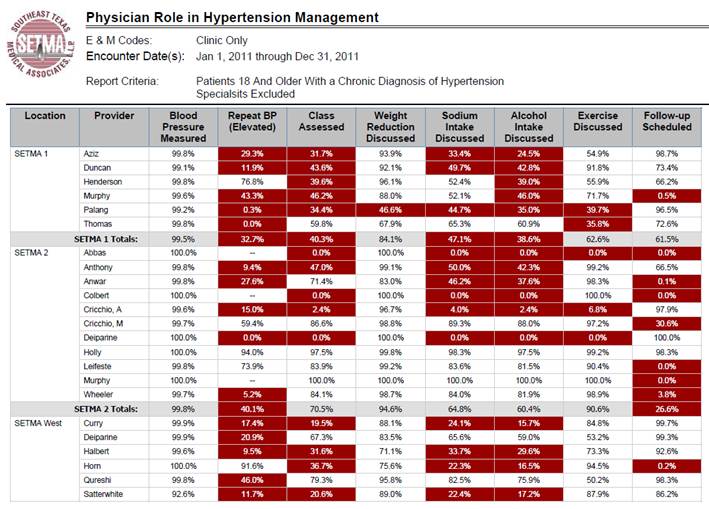
- 9 PCPI measures related to the physician role in hypertension management;
- 43 measures of the Bridges to Excellence program for Asthma, Chronic Stable Angina, Congestive Heart Failure, COPD, Diabetes and Hypertension;
- 10 PCPI related to Diabetes;
- 6 PCPI for Stages 4 and 5 of Chronic Kidney Disease;
- 5 PCPI for Chronic Stable Angina;
- 7 PCPI for Congestive Heart Failure;
- 20 PCPI Transition of Care measures.
We are also participating in the Guidelines Advantage Program which is a collaborative between the American Heart Association, the American Diabetes Association and the American Cancer Society. And we are tracking the metrics associated with the MA STARS, the ACO quality metrics and the Meaning Use metrics.
In addition to endorsed-measurement sets, SETMA tracks these self-designed quality measures: 10 measures related to hyperlipidemia; 12 measures related to Chronic Kidney Disease Stages 1-III. Also, in the hospital setting, SETMA has designed an internal study to identify patterns in hospital readmissions, such as lengths of stay, morbidities and co-morbidities, socio-economic status, ethnicity, gender, age, follow-up calls, follow-up visits in clinic, etc.. The purpose is to control cost and increase safety by reducing preventable readmissions to the hospital.
Population Management and Quality Improvement Metrics
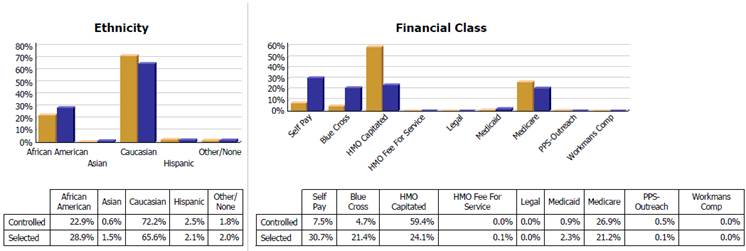
SETMA tracks a number of key data points for diabetes, hypertension and hyperlipidemia for its entire patient population. These measures are compared between patients who are controlled against patients who are not controlled. Secondly, the results for the controlled and uncontrolled populations are further analyzed by gender, age, ethnicity, numbers of medications, frequency of visits, frequency of test, income and other measures in an effort of to reduce disparities in patient care across all demographics.
To ensure timely compliance by providers, SETMA has designed functions with its EHR to alert providers to patient conditions which must be reported to local or state agencies for infectious disease control. SETMA reports the results of all of measures publicly, by provider name, at www.jameslhollymd.com.
The New York Times Magazine of May 2, 2010, published an article entitled, "The Data-Driven Life," which asked the question, "Technology has made it feasible not only to measure our most basic habits but also to evaluate them. Does measuring what we eat or how much we sleep or how often we do the dishes change how we think about ourselves?" Further, the article asked, "What happens when technology can calculate and analyze every quotidian thing that happened to you today?" Does this remind you of Einstein's admonition, "Not everything that can be counted counts, and not everything that counts can be counted?"
Technology must never blind us to the human. Bioethicist, Onora O'Neill, commented about our technological obsession with measuring things. In doing so, she echoes the Einstein dictum that not everything that is counted counts. She said, "In theory again the new culture of accountability and audit makes professionals and institutions more accountable for good performance. This is manifest in the rhetoric of improvement and rising standards, of efficiency gains and best practices, of respect for patients and pupils and employees. But beneath this admirable rhetoric the real focus is on performance indicators chosen for ease of measurement and control rather than because they measure accurately what the quality of performance is."
Technology Can Deal with Disease but Cannot Produce Health
In our quest for excellence, we must not be seduced by technology with its numbers and tables. This is particularly the case in healthcare. In the future of medicine, the tension - not a conflict but a dynamic balance - must be properly maintained between humanity and technology. Technology can contribute to the solving of many of our disease problems but ultimately cannot solve the "health problems" we face. The entire focus and energy of "health home" is to rediscover the trusting bond between patient and provider. In the "health home," technology becomes a tool to be used and not an end to be pursued. The outcomes of technology alone are not as satisfying as those where trust and technology are properly balanced in healthcare delivery.
Our grandchildren's generation will experience healthcare methods and possibilities which seem like science fiction to us today. Yet, that technology risks decreasing the value of our lives, if we do not in the midst of technology retain our humanity. As we celebrate science, we must not fail to embrace the minister, the ethicist, the humanist, the theologian, indeed the ones who remind us that being the bionic man or women will not make us more human, but it seriously risks causing us to being dehumanized. And in doing so, we may just find the right balance between technology and trust and thereby find the solution to the cost of healthcare.
It is in this context that SETMA whole-heartedly embraces technology and science, while retaining the sense of person in our daily responsibilities of caring for persons. Quality metrics have made us better healthcare providers. The public reporting of our performance of those metrics has made us better clinician/scientist. But what makes us better healthcare providers is our caring for people.
The ideal setting in which to deliver and to receive healthcare is one in which all healthcare providers value the participation by all other members of the healthcare-delivery team. In fact, that is the imperative of Medical Home. Without an active team with team-consciousness and team-collegiality, Medical Home is just a name which is imposed upon the current means of caring for the needs of others. And, as we have seen in the past, the lack of a team approach at every level and in every department of medicine creates inefficiency, increased cost, potential for errors and it actually eviscerates the potential strength of the healthcare system.
Why is this? Typically, it is because healthcare providers in one discipline are trained in isolation from healthcare providers of a different discipline. Or, they are in the same buildings and often are seeing the same patients but they rarely interact. Even their medical record documentation is often done in compartmentalized paper records, which are rarely reviewed by anyone but members of their own discipline. This is where the first benefit of technology can help resolve some of this dysfunction. Electronic health records (EHR), or electronic medical records (EMR) help because everyone uses a common data base which is being built by every other member of the team regardless of discipline. While the use of EMR is not universal in academic medical centers, the growth of its use will enable the design and function of records to be more interactive between the various schools of the academic center.
And, why is that important? Principally, because more and more healthcare professionals are discovering that while their training often isolates them from other healthcare professionals, the science of their disciplines is crying for integration and communication. For instance, there was a time when physicians rarely gave much attention to the dental care of their patients, unless they had the most egregious deterioration of teeth. Today, however, in a growing number of clinical situations, such as the care of diabetes, physicians are inquiring as to whether the patient is receiving routine dental care as evidence-based medicine is indicating that the control of disease and the well-being of patients with diabetes is improved by routine dental care. Also, as the science of medicine is proving that more and more heart disease may have an infectious component, or even causation, the avoidance of gingivitis and periodontal disease have become of concern to physicians as well as dentist.
Disruptive Innovation
In addition, Medical Home places major emphasis upon issues which historically have been the concern of nurses. Physicians who use EMRs are discovering that the contribution of nursing staff can make the difference in the excellent and efficient use of this documentation and healthcare-delivery method. No longer is the nurse a “medical-office assistant” ancillary to the care of patients, but the nurse is a healthcare colleague central and essential to the patient’s healthcare experience. As evidence-based medicine expands the scope of what The Innovator’s Prescription: A Disruptive Solution for Health Care By Clayton M. Christensen labels as “empirical medicine” which ultimately leads to “precise medicine,” it is possible for physicians and nurses to be a true-healthcare delivery team, as opposed to the nurses only being an aide to the physician.
It is as a result of the need for the integration of healthcare disciplines at the delivery level, that the imperative becomes obvious for the restructuring of the training of the members of this healthcare team. And, the first change must come in the relationships between the leaders of the training programs who educate and mentor future healthcare scientist, teachers, caregivers and researchers. The educational leaders must model this integration for their disparate student bodies and that modeling will require the investment of the most precious and rare resource: time.
Glue? Adhesion and Cohesion
What is the model for this restructuring of the relationships between schools in the academic healthcare centers? It has been suggested that there is “glue” which unites the members of the various schools in an academic healthcare center, which will ultimately create this team. I would argue with that. Glue is an adherent. “Adherence” is described and simultaneously defined by the following:
- “Two dissimilar parts touching each other but not fused.”
- “The union of separate parts; tending to adhere to or be connected by contact.”
If propinquity is the principle motivation for the forming of a team, it will not survive the stresses and pressures which tend to make the team fly apart.
On the other hand, “cohesion” is “the bonding together of members of an organization/unit in such a way as to sustain their will and commitment to each other, their unit, and the mission.” Synonyms of “cohesion” are “harmony, agreement, rationality.” Here is the source of the union of the various elements of the healthcare team in training. It is in the recognition of their commonness and in the acknowledgment of their being part of the same “organism.”
Harmonics
The concept of “harmony” is valuable here also. Harmony is not the absence of discord; it is the presence of a common nature. The typical definition for a harmonic is “a sinusoidal component of a periodic wave or quantity having a frequency that is an integral multiple of the fundamental frequency.” I smiled and chuckled aloud as I wrote this last sentence. It is a mouthful, but how is it related to our problem of healthcare delivery? If you have a room filled with tuning forks of different frequency and you strike one of the forks, all of the forks which are of the same frequency or a multiple of the same frequency, as the one struck, will begin to sound. Those which are intrinsically different will remain silent.
In a room of educators, some health science, some historians, some vocalists, some archeologists, etc., when the sounding is of excellent in healthcare delivery; when the sounding is of evidence-based medicine; when the sounding is of containing the cost of healthcare while maintaining the quality; when the sounding is of increasing the accessibility of healthcare by removing barriers of affordability, linguistics, literacy, etc; each member of the healthcare-education team, whether nurse, dentist, physician, scientist, physical therapist, laboratory technician or other, will begin to resonate, as they are all coherent, by their nature, to the process of sustained improvement in the delivery of healthcare.
It is as if the healthcare-education team, as the healthcare-delivery team, has become a symphonic orchestra made up of instruments which are different in sounding method but which harmonize to produce an aesthetically satisfying result. Remember, the Greek word “symphonia” means “sounding together.” So it is that the members of the healthcare-education and the healthcare-delivery team “resonate together” to produce the results we all desire.
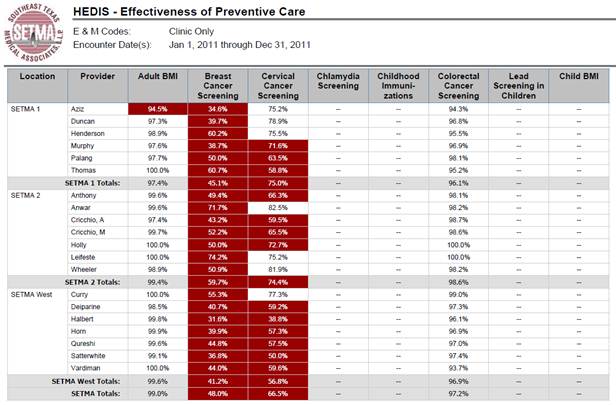
A. Preventive Care Measures (e.g., % screened for breast or cervical cancer)
| X | Quality Improvement |
| X | Reporting |
| X | Practice Management |
| Pay for Performance |
| Other |
- Traditional preventive care such as cancer screening (breast, cervical, prostate, colon)
- Diabetes prevention and diabetes screening
- HIV screening for all patients between 13 & 64 years of age
- Hypertension Prevention
- Tobacco prevention
- Obesity prevention
- Sedentary life style
- Immunizations (flu, pneumovax, tetanus/diphtheria/acellularpetrussis)
- Glaucoma Screening
- Renal Disease Screening
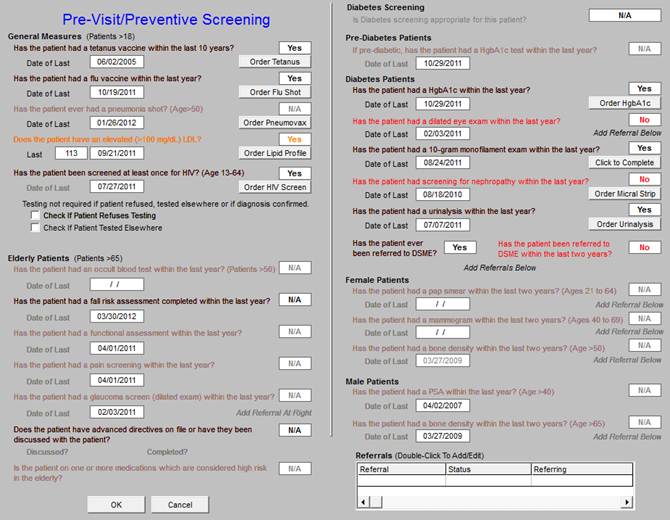
The first step in this preventive program is the following template which address almost all preventive and screening studies done. The first thing the nurse does after completing the patient’s weight, blood pressure, body fat, etc., is to open the Pre-Visit/preventive Screening template. The measures which apply to the patient and have been done will appear in black. The measures which apply to the patient and have not been done will appear in red and the measures which do not apply to this patient will be in grey.
Any measures which apply and have not been completed can be fulfilled by clicking the “order” button which appears beside each element. When that button is clicked, three things happen:
- The test or procedure is ordered.
- The charge is sent to billing - but will not be sent to the payer until it has been done.
- The test is placed on the patient’s chart.
- The metric is marked as done.
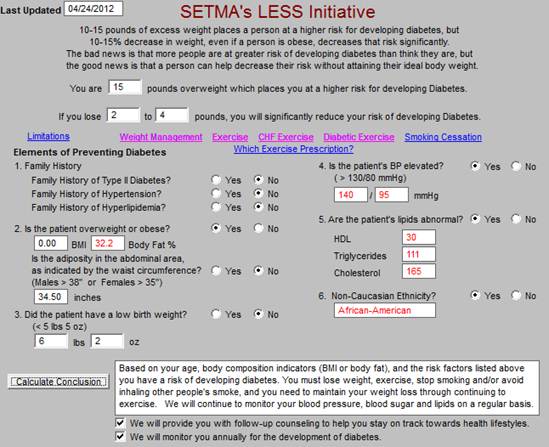
The second thing the nurse does is to complete the LESS Initiative by clicking the following:
- Weight Management - this shows the disease risk of the patient’s weight, the patients BMI, BMR, Body Fat Percent and an explanation of energy metabolism and how to change the BMR.
- Exercise - this explains to the patient how to get started and provides a personalized exercise program including a walking program. It is scaled to the Cooper Aerobic data. If the patient has exercise limits, i.e., CHF, Diabetes, etc., specialized exercise prescriptions can be completed.
- Smoking Cessation - this addresses primary, secondary and tertiary tobacco use and strategies for stopping.
Once this is done, a document is completed which summaries all of the patient’s personal data which is given to the patient. SETMA audits nurse and provider performance on The LESS. There is a laser printer in every examination room and the document is printed and given to the patient at that time.
.
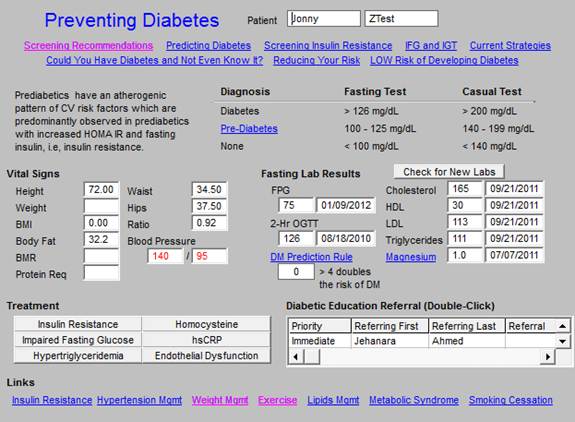
At the time of the Less Initiative being completed the nurse completes the “Screening Recommendations” for diabetes and if the algorithm requires it and the patient is fasting the appropriate screening test is performed. Other tools as seen below are also available for the appropriate patients such as “reducing your risk,” “could you have diabetes and not know it,” “predicting diabetes,” etc. We tell all of our patients who are at risk of developing diabetes, “The best way to treat diabetes is don’t get it.”
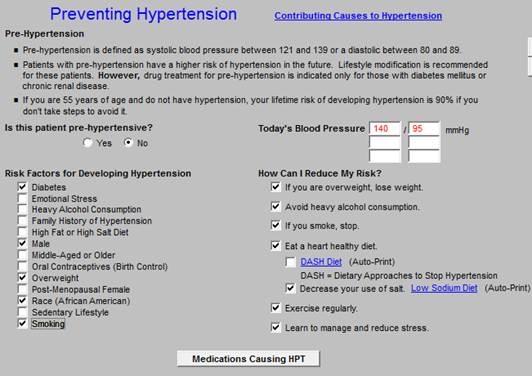
The Preventing Hypertension template is also completed at this time and the materials go on the patients chart. We particularly focus at this point on patients with pre-hypertension.
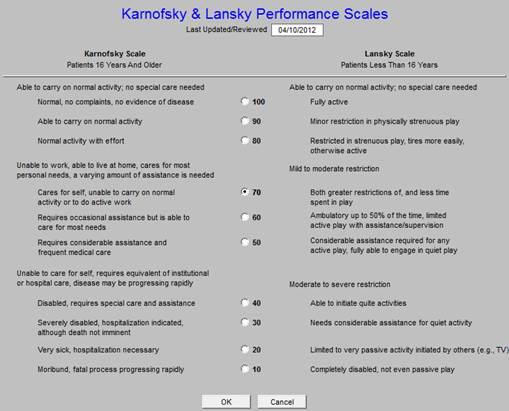
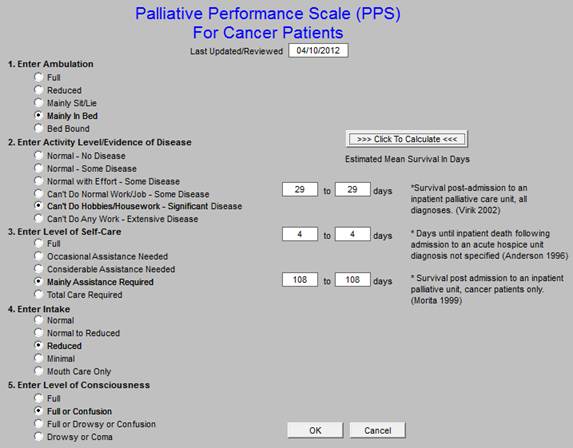
Part of SETMA’s Preventive Health/Wellness Program involves the following questionnaires which are completed once a year on each of our patients. The following is a link to a tutorial on how to use these materials: Here
Those questionnaires are found on the front page of our primary care suite of templates.
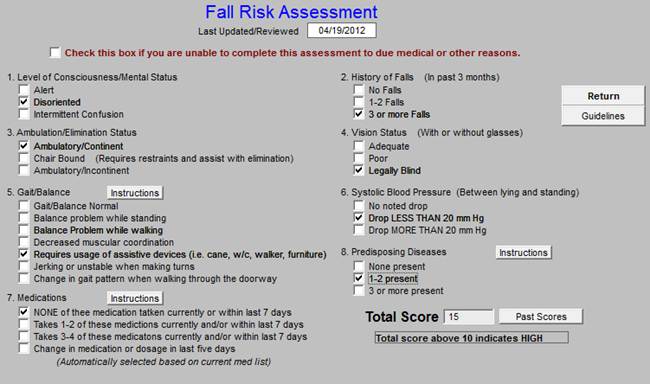
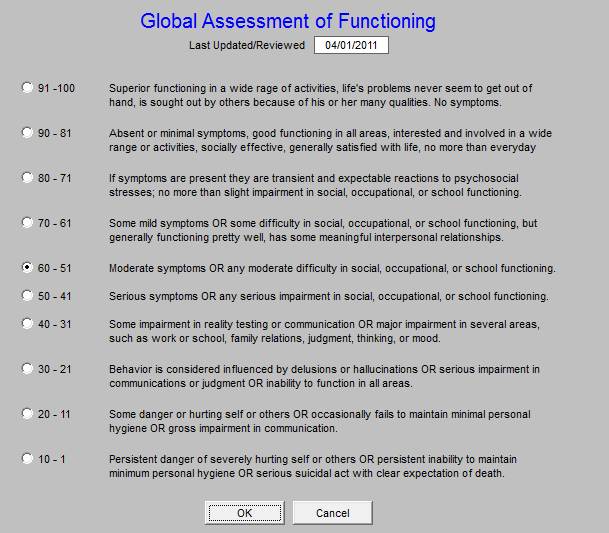
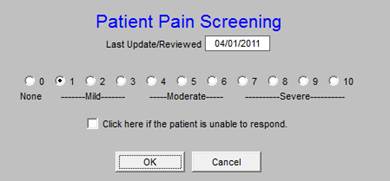
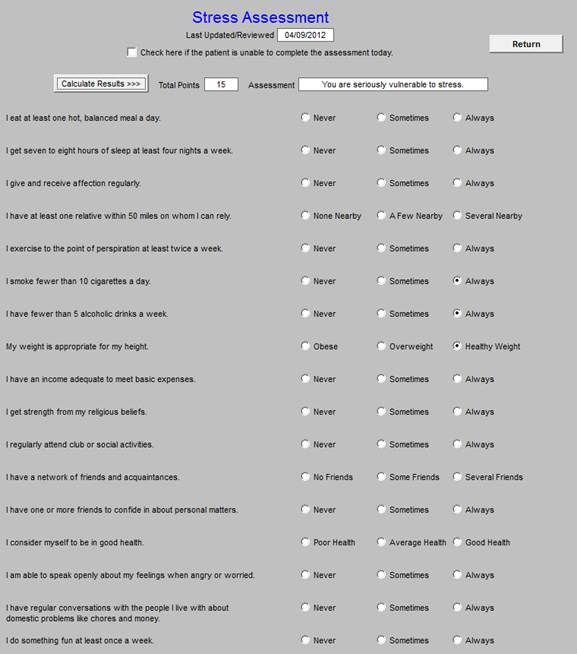
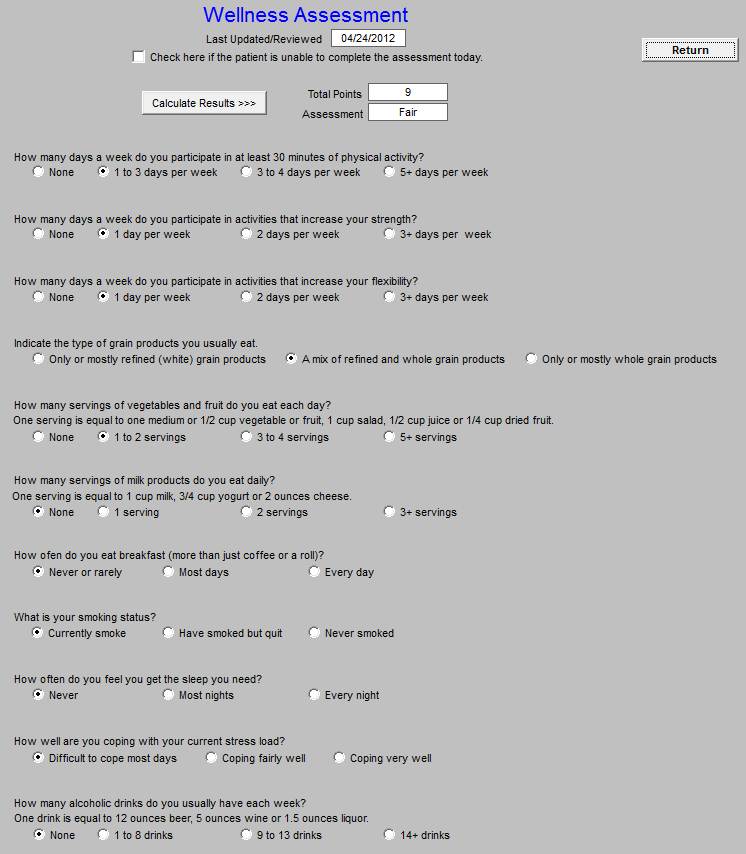
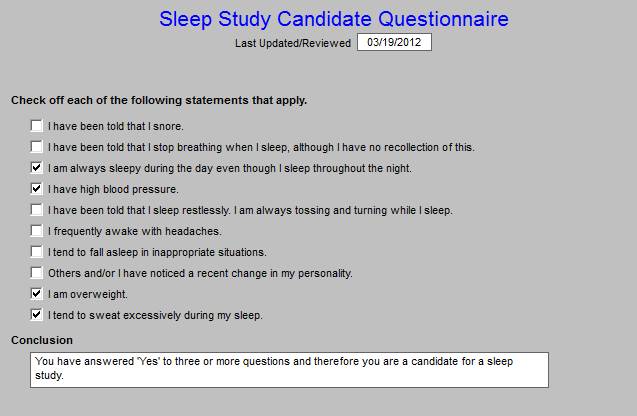
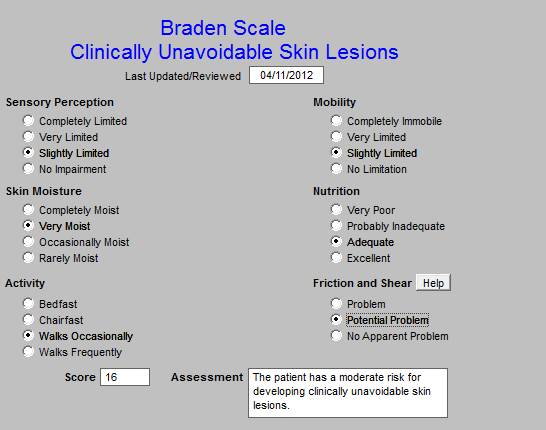
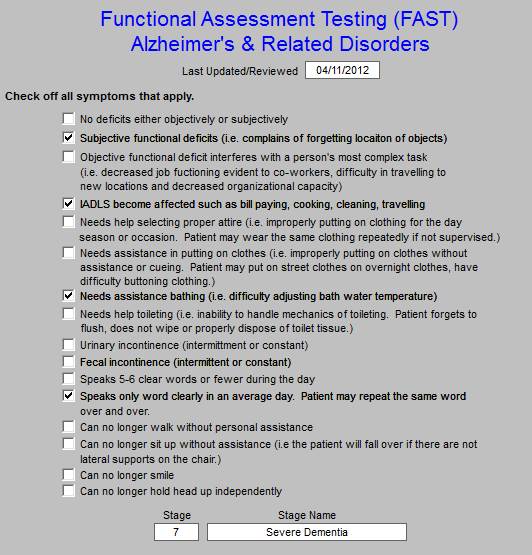
The following four questionnaires are used exclusively for patients who may be eligible for hospice care:
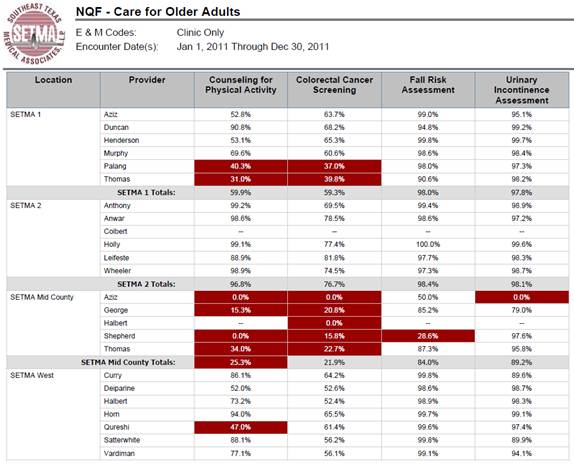
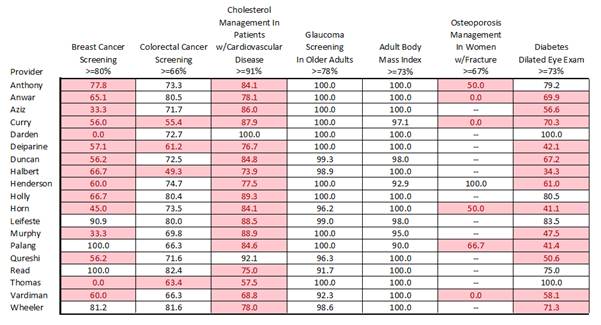
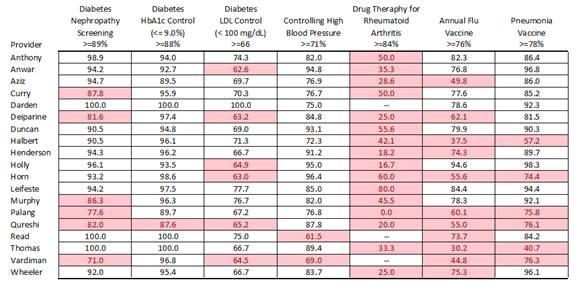
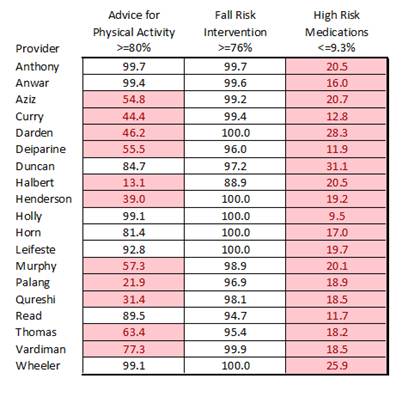
The following are our audits for preventive services. SETMA Mid County is a brand new clinic and the providers there are new. Their performance will improve quickly. We are only giving you the data for 2011, but on our website all of the data for 2009, 2010, 2011 and the first quarter of 2012 are posted. Each month, SETMA’s providers and nurses have a training meeting in which the use of the disease management tools, clinical decision support tools and provider performance audits are reviewed. Opportunities and plans for improvement of our performance on the Triple Aim are discussed.
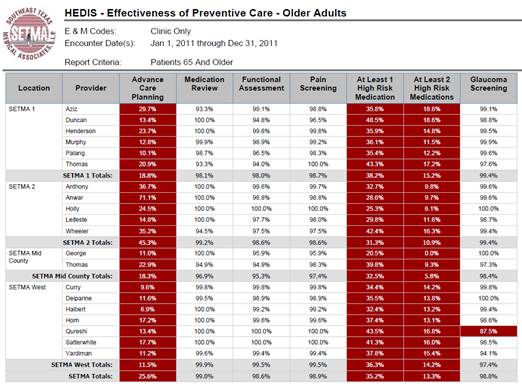
We have a major effort going forward to decrease the use of potentially high risk medications.
The following are the auditing results for screening of our Medicare Advantage patients which represent 32% of our patients and 50% of our visits. This data is for January-March, 2012
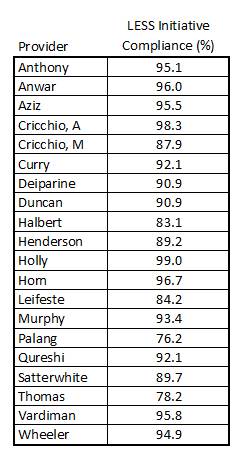
The following is the 2011 audit for performance on the LESS Initiative. We consider anything above 95% as being acceptable.
B. Clinical Performance Measures (e.g., % diabetics with HbA1C <9%)
X - We collect this type of data routinely and use it for:
| X | Quality Improvement |
| X | Reporting |
| X | Practice Management |
| X | Pay for Performance |
| Other |
SETMA does extensive clinical performance measures, all of which are found on our website at the following link: Public Reporting I will only illustrate three here:
- Diabetes
- Hypertension
- Lipids
| The following is the front page of our Diabetes Disease Management tool: | Table of Contents |
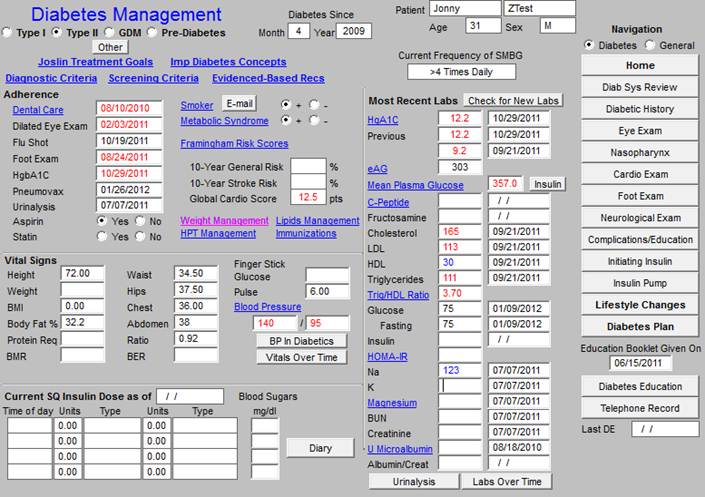
The Diabetes Disease Management tool is interactive with all of the patient’s record. The following is the link to the full Diabetes Management Tool tutorial.
From the work documented in the Diabetes Disease Management Tool, the following analytics can be done.
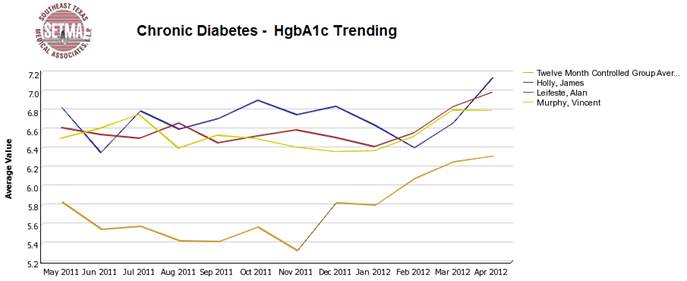
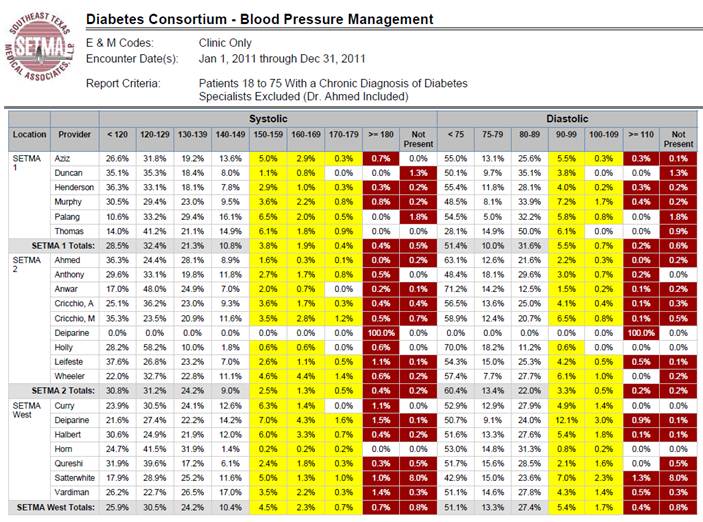
Through this longitudinal display, in 2009, we discovered that our patients who were well controlled all year were often losing their control of diabetes in October, November and December. We then did further audits to see if they were being seen less often and being tested less often and they were. In 2010, in September, we sent letters to all 7,000+ patients with diabetes alerting to this fact. We indicated we wanted them to enjoy holiday celebrations but to maintain their exercise and dietary discretion. We had them sign a contract to be seen twice in those three months and to be tested twice. In 2011, our audit showed that this phenomenon had disappeared.
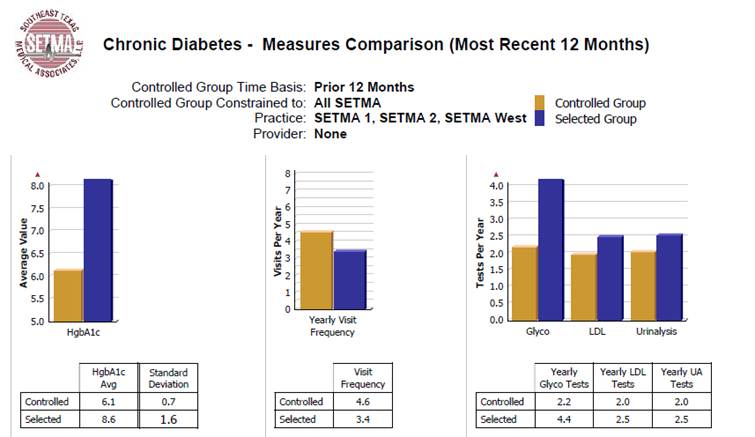
The above compares the standard deviation of our controlled patients with diabetes (gold) and that of the uncontrolled. We established our goal to be .7 for our diabetes populations. We discovered that our controlled patients were seen 1.2 times more often. This is statistically significant and we saw an opportunity to improve the control of all of our patients by making sure that all patients with diabetes had 4-5 visits a year.
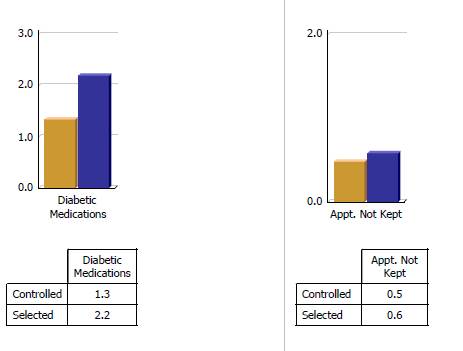
No leverage points for improvement were found in the data above. (the controlled are gold and are patients with diabetes treated to goal and the selected are the uncontrolled patients in purple)
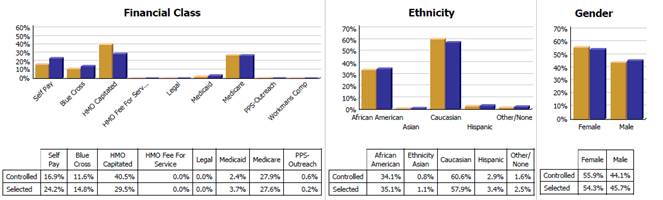
From the above, we found that our HMO capitated patients who have a zero office co-pay are treated more effectively than Fee-for-Service Medicare allowing the inference that the cost of care for the FFS Medicare patients is a barrier to the effectiveness of care in that when that barrier is removed in a similar population that the care improves. We were able to see that for diabetes we had eliminated ethnic disparities of care.
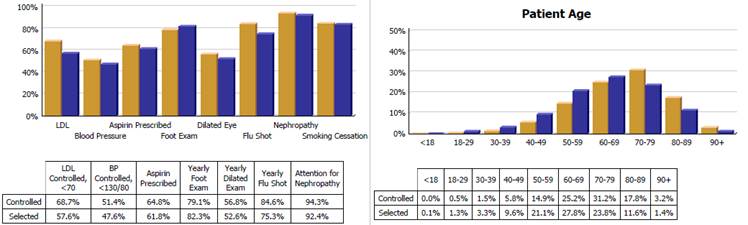
From the above profile, we were able to see that our older patients have better control of diabetes than our younger patients. Concerned that this might reflect co-morbidities rather than excellence of care, we tested the patients for malnutrition (pre-albumin), weight loss and appetite and found that they were not malnourished but were responding well to increased attention.
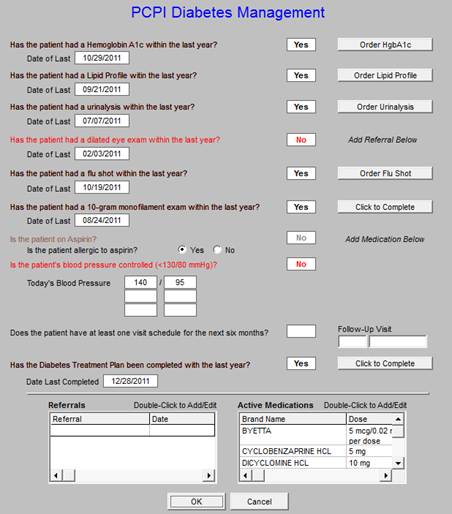
The following is the diabetes quality measurement set of PCPI. The elements are collected automatically without the provider doing anything, but at the point of service, once the provider completes the audit of patent’s care can be reviewed by the provider.
The following is the PCPI diabetes audit for 2011. Once again, 2009, 2010, 2011 and the first quarter of 2012 are on our website.
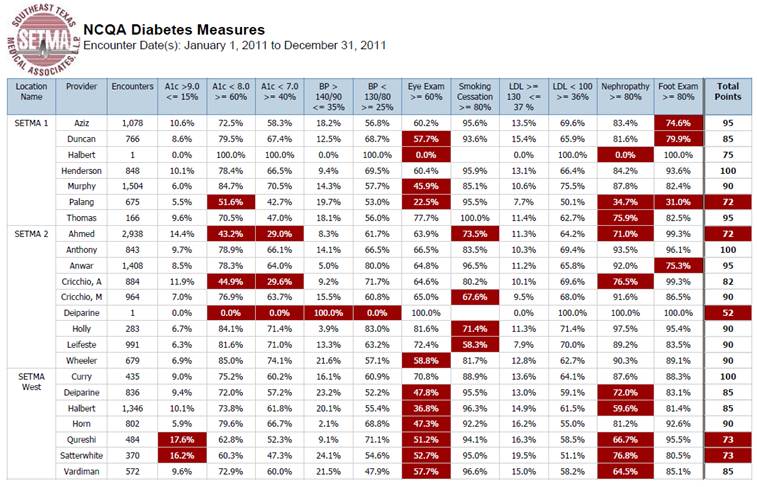
There are currently twelve different published audit sets for diabetes. We track all of those. The following is the audit set with measures, discriminators and the aggregate score for the NCQA Diabetes Recognition program. That program changed this in February of 2012 and SETMA is updating our audit to reflect the new standards. All of SETMA providers and clinics have NCQA Diabetes Recognition.
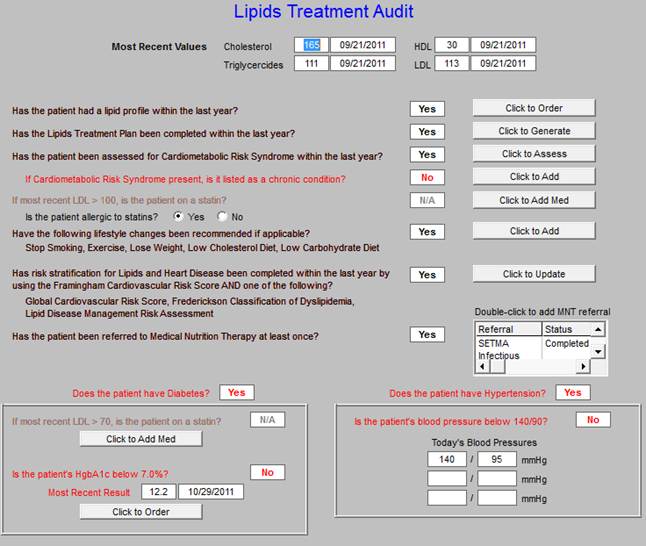
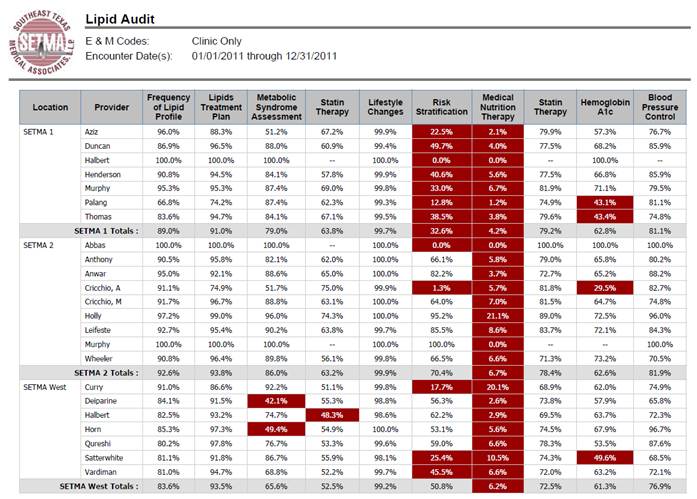
The following is the master template in the Lipid Disease Management Tool built by SETMA. The link to the full tutorial is: Lipids Tutorial
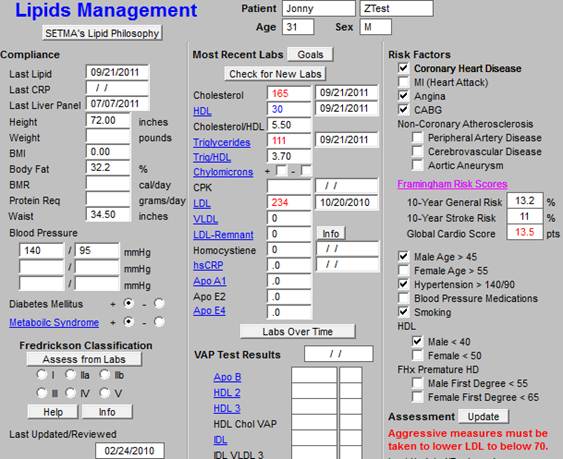
With the use of the disease management tool for Lipids, the following auditing and analytics can be done electronically.
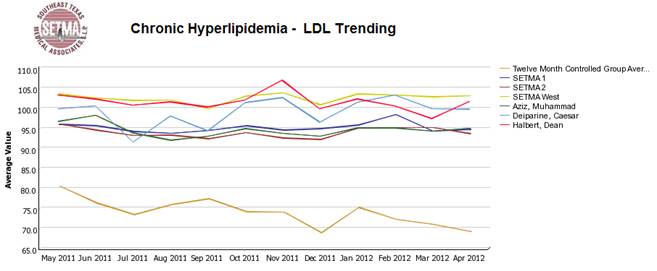
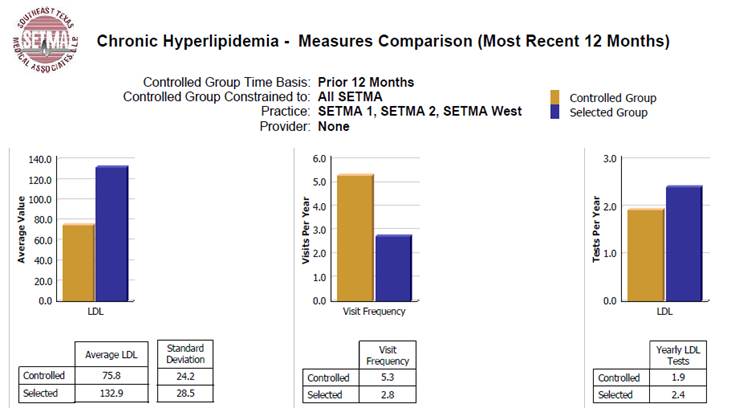
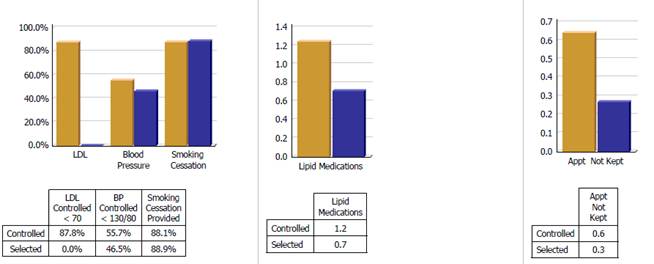
The following audit shows that we have not eliminate ethnic disparities in care of patients with dyslipidemia. We believe this is cultural and we are working on it. We see once again that our Medicare Advantage patients (HMO) are better treated that our Medicare FFS patients.
There is no nationally endorsed quality metric set for lipids, therefore SETMA design this one and the audit bellows shows our performance.
The following is the audit of the Lipid Quality Metric set which allows us to see leverage points for improvement.
This is the link to the full tutorial: Hypertension Tutorial
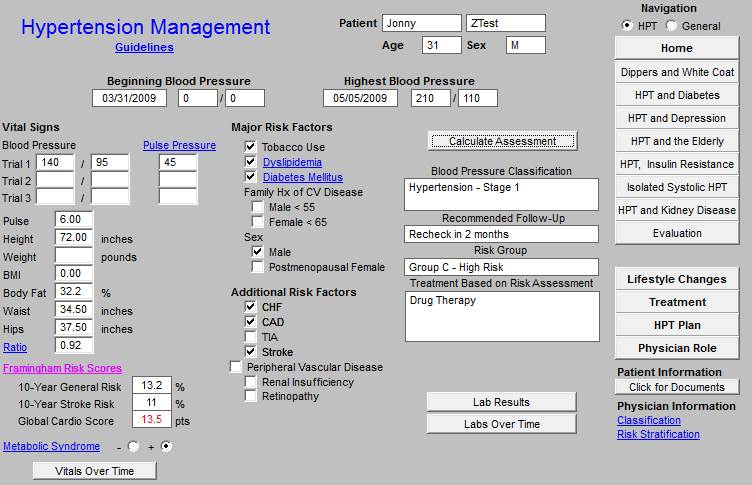
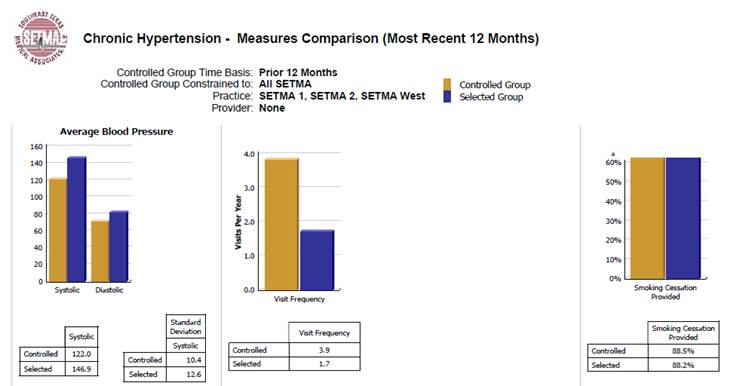
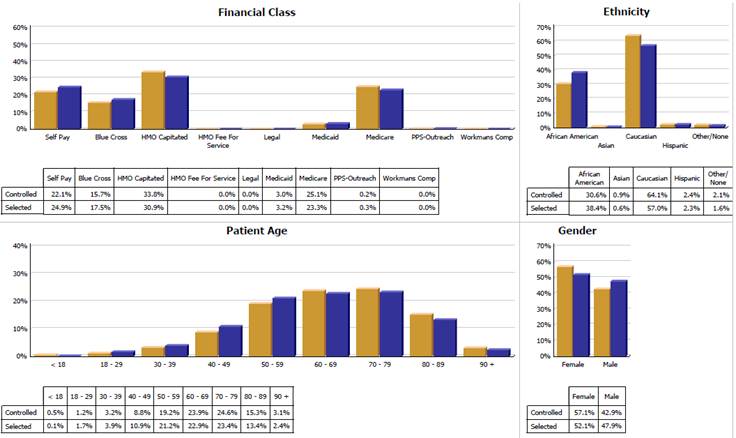
The following are the audits and analysis which we perform for hypertension as we look for patterns and points of leverage for improving the care of our patients with hypertension as we see their health improve and for a lower cost.
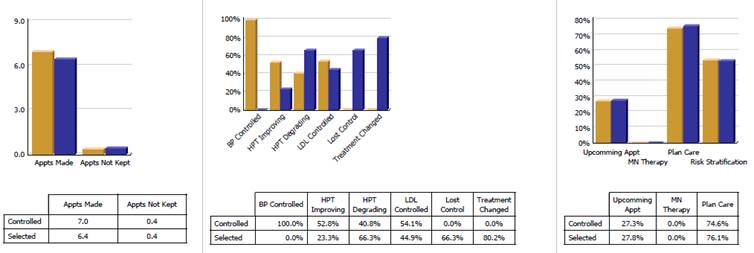
The analytics allow us to compare the patients treated to goal and those who are not to goal in order to discover leverage points for improving the care of all patients. Elements analyzed are frequency of visits, numbers of medication, gender, payer class, ethnicity, age, frequency of testing, etc. In that these analytics are all done electronically, they do not take much time and can be done with increased frequency for increased value. One of the most important elements of analysis is the determining of whether a change was made when a patient is seen who is not to goal. The overcoming of clinical inertia is critical to the improving of patient health or outcomes.
Below, you will see an element entitled “Treatment Changed.” In the patients who were not to goal, 80.2% of the time a change was made in the treatment! That is excellent.
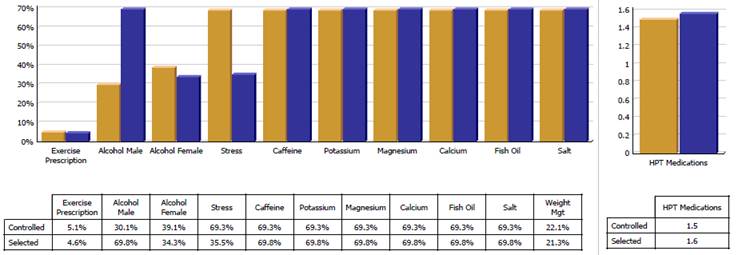
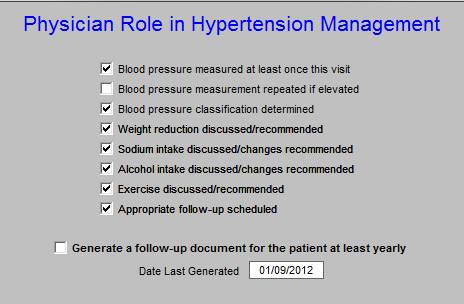
This is the PCPI Quality Metrics SET for hypertension and following that is the audit for hypertension care.
X - We collect this type of data routinely and use it for:
| X | Quality Improvement |
| X | Reporting |
| X | Practice Management |
| Pay for Performance |
| Other |
Organizational measures which SETMA routinely collects are:
- Daily Cash Flow report - in order to sustain our quality initiatives, we must maintain the fiscal soundness of the practice. The third prong of the Triple Aim is “lower cost,” which really addresses the issue of sustainability. SETMA is debt free and maintains careful accounting of our overhead, cash management, over time, timeliness of payments, cash balances and strategic planning which requires financial resources. All of these are measured and reported on daily and quarterly and annually. They are not included in summary because they are confidential, but they are as critical to quality improvement as anything else we do.
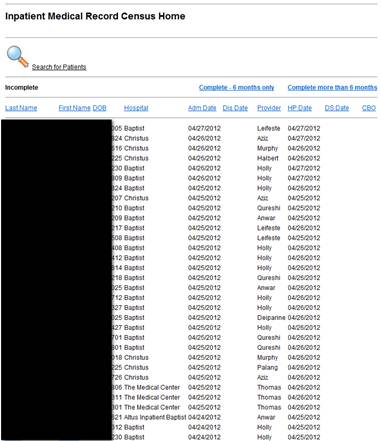
- Hospital admission and discharge tracking -- SETMA designed the IMRC (Inpatient Medical Record Census) which tracks date of admission and date of when the history and physical examination was completed and date of discharge and date when discharge summary was completed. Nine years ago, we have five different departments trying to keep an accurate hospital census. Now there is a central, electronic one.
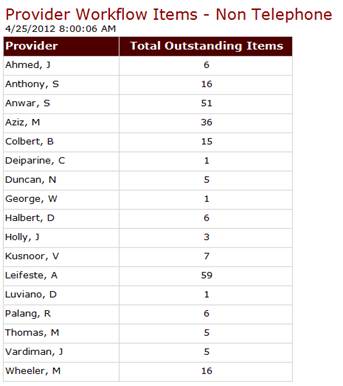
- Work Flow completion - everything we do is electronic. Daily we audit whether providers have completed their work flow where they are alerted to telephone messages, laboratory results, consultations and procedure results.
- Referral Tracking
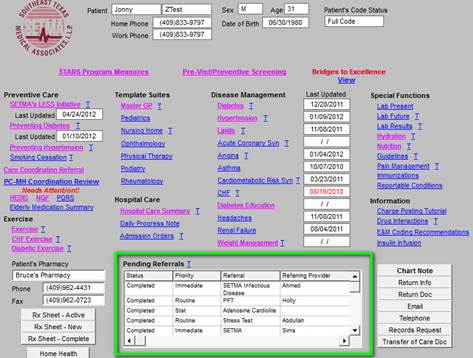
SETMA monitors the progress of referrals through the system from their origination, to their approval, to the appointment or procedure being scheduled to the results of the referral request being returned to the order provider.
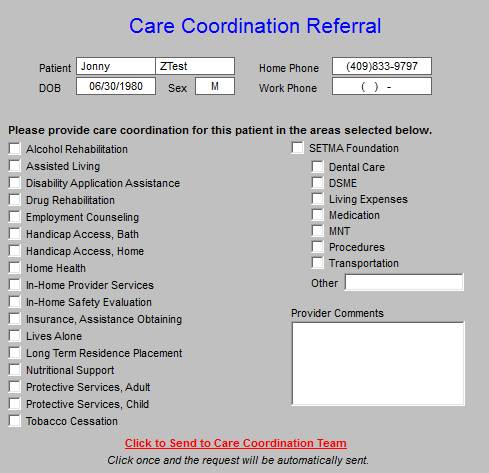
- In 2008, SETMA formed a Foundation through which our patients can receive support for needed care. The provider can send a Care Coordination Referral for any of the following causes. They are all processed the day they are received. For each of the last three years, the partners of SETMA have given $500,000 to the foundation. We have seen dramatic changes in patients’ lives due to their having access to care they could not otherwise afford. None of the Foundation money can profit SETMA.
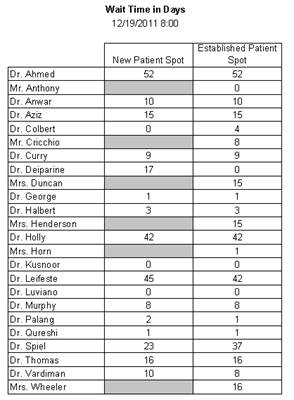
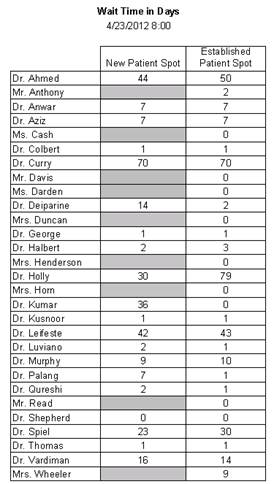
- Number of days until the next appointment is available - Patient experience who requested As Soon As Possible Appointment
- A total of 1919 appointments were made with the type “_Established - ASAP%’ from February 15 thru April 15.
- Of the 1919, 990 where scheduled the same day the request was made.
- Of the 1919, 666 were scheduled the next business day (Friday scheduled on Monday) after the request was made.
- Of the 1919, 199 were scheduled within two business days (Friday scheduled on Tuesday) after the request was made.
- Of the 1919, 64 were scheduled within three or more business days (Friday scheduled on Wednesday) after the request was made.
- How many patients received their Hospital Care Summary and Post Hospital Plan of Care and Treatment Plan (previously called “Discharge Summary”) at the time of leaving the hospital?
- For 2011, 97.7% of all discharges had documentation completed at the time of discharge.
- For the past 39 months, SETMA has discharged 12, 236 patients from the hospital, 99.1% of the time, the patient, family and/or care giver has received the Hospital Summary at the time of discharge.
The receiving of this document is one of the most critical steps in our “reducing preventable readmissions” quality improvement initiative.
This same document is completed for patients seen in the emergency department and discharged without having been admitted to inpatient status.
| X | Quality Improvement |
| X | Reporting |
| X | Practice Management |
| Pay for Performance |
| Other |
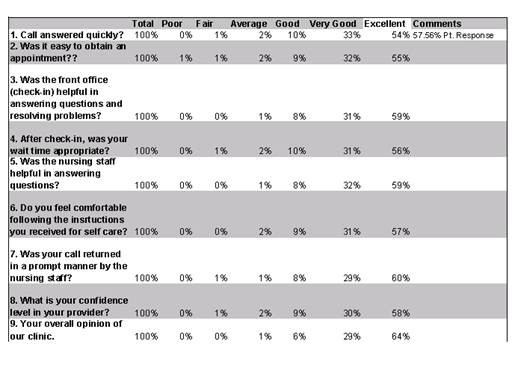
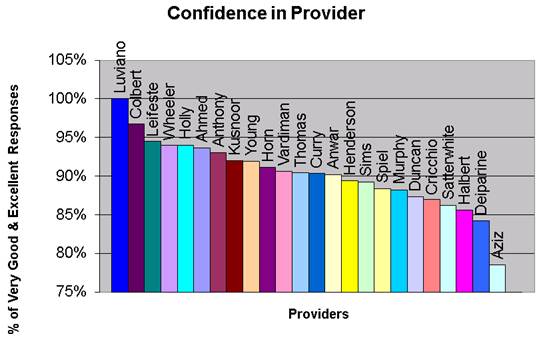
SETMA is studying the Consumer Assessment of Healthcare Providers and Systems (CAPHS) program to see if we can adopt it to improve our patient satisfaction analysis.
The following are the minutes from the April, 2011 QIO Committee meeting about patient satisfaction results.
The past survey results were analyzed comparing fourth quarter 2008, 2009, and 2010. The most recent 4th quarter data showed a decline from 4th quarter 2009 where results were at their peak. Each clinical coordinator received the data and reviewed this data with the Director of Operations. Provider data was sent individually to each of them for their review. Clinical Coordinators were instructed to share the results with staff and brainstorm ideas and ways to improve results. SII typically has the best scores. The Mark A Wilson SETMA West (MWSW) clinic will rearrange the clinic responsibilities for the desk clerks. SI has recently moved clerks to different pods. This occurred during the 4th quarter of 2010. Staff have adjusted to the transition and are settled now in new positions and time will show if this move was beneficial to patient satisfaction.
The survey results were compared to first quarter 2010 and 4th quarter aggregate 2010. Survey results overall have declined however SI has shown the most dramatic decline. In the two specific areas - speed of nursing staff returning calls and confidence in provider SII maintained above 50% in each of these categories. There was slight improvement in returning calls to 57% and a slight drop in physician confidence to 67%. MWSW did not see improvement with phone calls however the desk clerk change has not taken place. The score for this is 33%. The physician confidence is above the target and did improve to 67%. SI dropped significantly in returning calls to 29% and the physician confidence also dropped to 35%.
MWSW supervisor, by May 2, 2011 follow through and rearrange unit clerks to have an extra devoted to walk in patients and assisting with patient calls in addition to the 5 clerks assigned to providers. This has been done through staff cross training and required no additional hire at this time.
SI supervisor, by April 29, 2011 will meet individually with each staff member and provider to discuss scores and brainstorm ideas for improvement. Director of Operations will discuss weekly with supervisor progress made and initiatives started to monitor progress. Supervisor will seek patient feedback by specifically setting time on Wednesdays to meet with random patients from each pod to ask about their care, response to phone calls etc. Also when the next survey is done, depending on staffing availability, attempt to have non SETMA I employee offer to assist patients with reading and understanding questions as many of the clientele at SI are elderly and may need assistance with seeing the survey questions.
The committee met and recommended having 6 - 10 random friends/family call the main SETMA number to see if there are identified issues with satisfaction related to appointment staff. The callers will complete a survey about each call. They will be looking to see if the staff identified themselves, if they were asked if the call was related to a medical question or an appointment and their overall impression of the call. The survey will be ready for use by Monday May 2 and the identified callers will receive general instructions to use in order to prevent an actual appointment from being made but that can still capture the information needed. Calls will be made Monday and Wednesdays between 8 and 9 am and then either Tuesday or Thursday in the afternoons. Each caller will be asked to make 3 calls on different days. Results will be analyzed and taken back to the subcommittee for recommendations.
| X | Quality Improvement |
| X | Reporting |
| X | Practice Management |
| Pay for Performance |
| Other |
Because turnover is a measure of employee satisfaction, SETMA yearly evaluates the turnover rate for our organization. Since 2007 we have seen significant decrease in turnover. The Human Resource department is responsible for ensuring an employee friendly atmosphere. There have been several initiatives over these years that recognize and reward the employees. These efforts have paid off as evidenced by the turnover, see results below.
Department |
# FTE’s
authorized |
#FTE’s
filled as of 12/31/11 |
# resigned |
# termed |
2011
Year end turnover |
2010 year end turnover |
2009 year end turnover |
2008 year end turnover |
2007 yr end turnover |
2006
yr end
turn
over |
SETMA Wide |
225.5 |
221 |
14 |
5 |
9% |
7% |
17% |
13% |
42% |
39% |
SETMA also does employee focus groups where random employees are chosen to participate. With these focus groups the employees are able to bring up issues they would like to see changed within the organization. The last of our focus groups revealed a very small amount of issues to discuss.
Addendum A
SETMA’s Major Initiative to Reduce Preventable Readmissions
The following is a description of the tools, of the audits and the analytics associated with SETMA’s major quality improvement initiative to decrease the preventable readmissions. Our program is working as one hospital reported that our 30-day readmission rate at their hospital had dropped to 7.6% for all admissions.
The first step in this process is the completion at the time the patient leaves the hospital of a summary of their hospital stay and of their instructions and schedule for the transition to the ambulatory setting or to other points of care. The following is a link to the tutorial which explains all of our preparation of this document.Hospital Care Summary and Post Hospital Plan of Care and Treatment Plan Tutorial
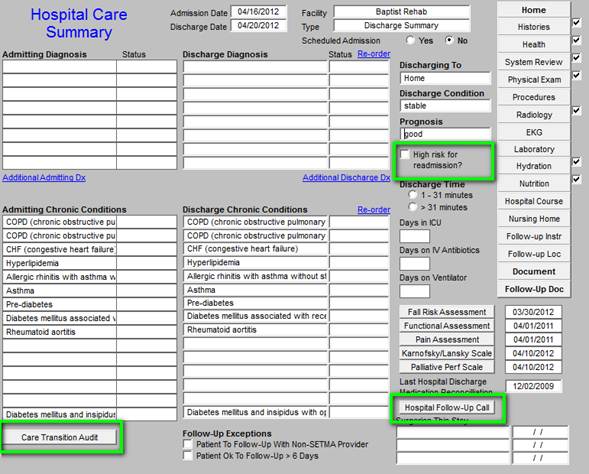
The summary of the hospital stay is completed with a suite of templates. As is show in the green outline above, the keys to the Hospital Care Summary and the Post Hospital Plan of Care and Treatment Plan are:
- Designation of the patient as high risk for re-admission or not. If they are high risk a series of interventions are initiated which are discussed below.
- Hospital follow-up call is schedule which occurs on day after discharge and is a 12-30 care coaching at which time a third medication reconciliation is done. The first is done at admission, the second at the time the patient leaves the hospital and the third during the care-coaching call. A fourth reconciliation is done at the follow-up clinic visit.
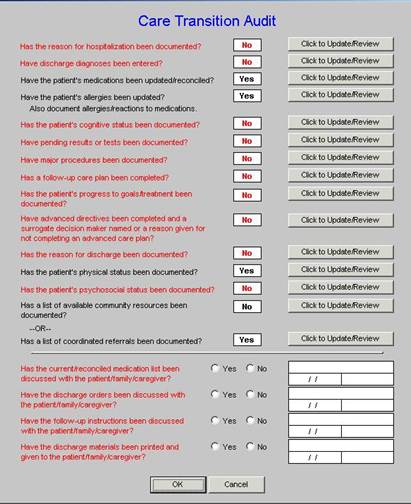
- PCPI Care Transitions audit is performed.
Nothing is more is more important to the process of successfully decreasing preventable admissions than is an effective Care Transition process. In SETMA’s Model of Care -- Care Transition involves:
- Evaluation at admission -- transition issues: “lives alone,” barriers, DME, residential care, or other needs
- Fulfillment of PCPI Transitions of Care Quality Metric Set
- Hospital Care Summary and Post Hospital Plan of Care and Treatment Plan
- Post Hospital Follow-up Coaching -- a 12-30 minute call made by members of SETMA’s Care Coordination Department and additional support
- Follow-up visit with primary provider
Focus in care coordination by the NPP are the links between:
- Care Transitions - ...continually strive to improve care by ... considering feedback from all patients and their families... regarding coordination of their care during transitions between healthcare systems and services, and...communities.
- Preventable Readmissions - ...work collaboratively with patients to reduce preventable 30-day readmission rates.
- Once the Care Transition issues are completed, The Hospital Care-Summary-and-Post- Hospital-Plan-of Care-and Treatment-Plan document is generated and printed. It is given to the patient and/or to the patient’s family and to the hospital.
The following is a link to my presentation on SETMA’s 14-year history of developing the tools and capacities to do effective Care transitions. It is entitled, Care Transitions: The Heart of Patient-Centered Medical Home.
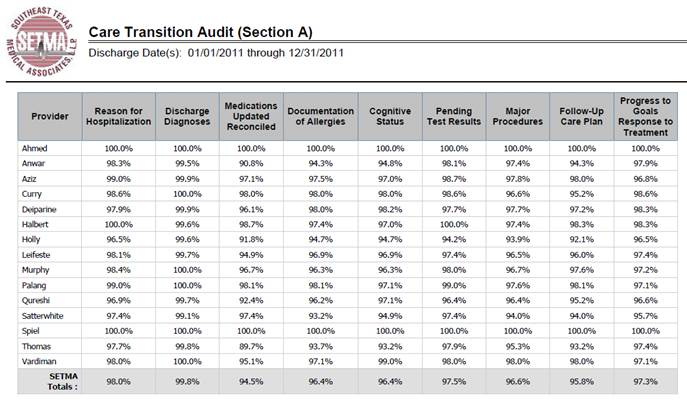
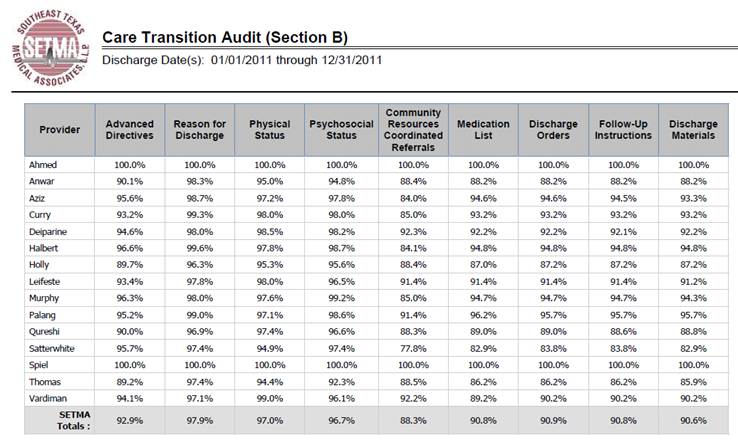
The following are examples of SETMA’s Care Transitions audit:
The second most important part of Care Transitions is the scheduling of the hospital follow-up, care-coaching call. The following is the follow-up call scheduling template.
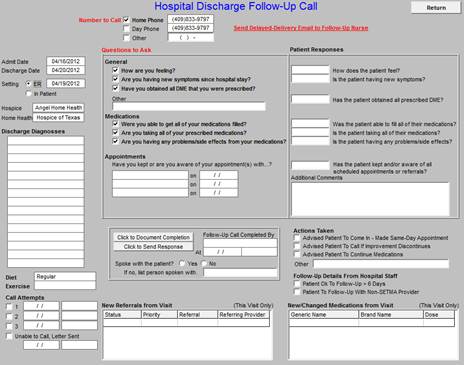
The following BI analytics are done on all patients who leave the hospital. They contrast patients who are readmitted and those who are not looking for leverage points for decreasing readmissions. Thus far, we have found only two variables that really predict readmission probability:
- Did the patient receive their care coaching call.
- Were they seen in the clinic in follow-up within three days if they are high risk and within six days if they are not.
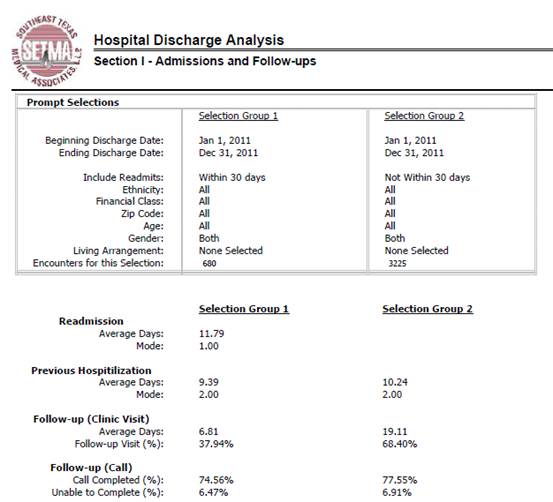
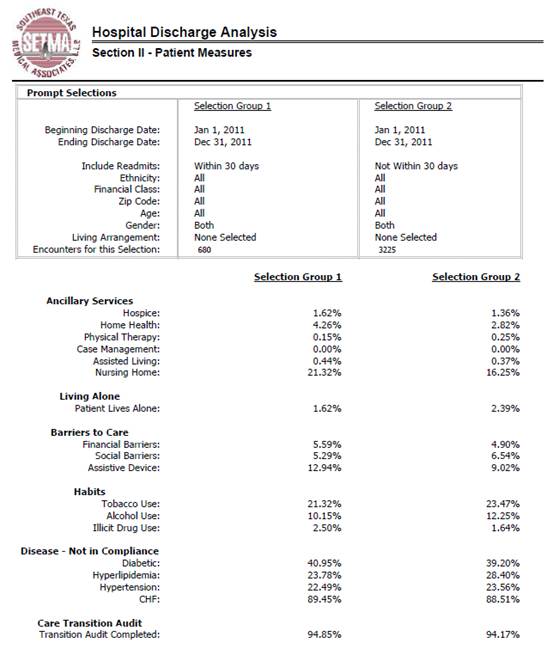
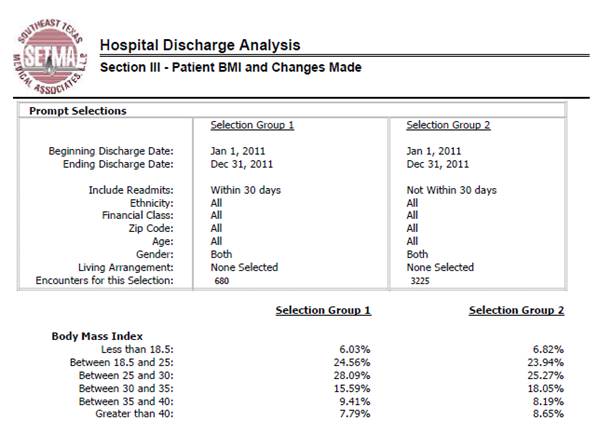
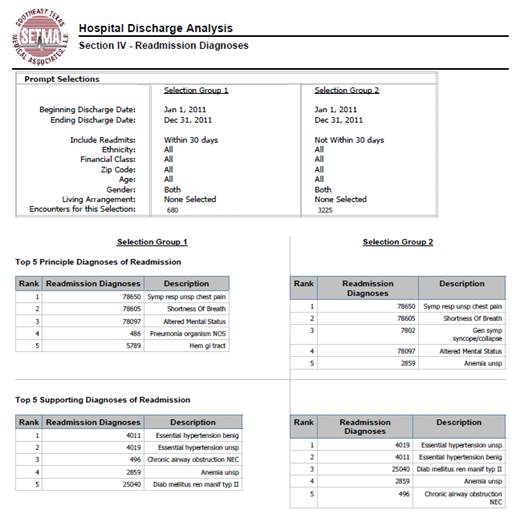
By analyzing the above data, it is possible to find leverage points for decreasing readmission.
The Hospital Care Summary and the Post Hospital Plan of Care and Treatment Plan document along with a personal explanation of the tool is the method by which responsibility for the patient’s care is transferred from the provider and the inpatient to the patient and the ambulatory setting. We call that tool The Baton.
|
The Baton - the transition of care tool
“The Baton” is a pictorial representation of the patient’s “plan of care and the treatment plan,” which is the instrument through which responsibility for a patient’s health care is transferred to the patient. Framed copies hang in all public places throughout SETMA’s clinics. A poster copy hangs in every examination room. The poster declares:
Firmly in the providers hand
--The baton - the care and treatment plan
Must be confidently and securely grasped by the patient,
If change is to make a difference
8,760 hours a year.
|

|
The poster illustrates the following seven key principles:
- That the healthcare-team relationship, which exists between the patient and the healthcare provider, is key to the success of the outcome of quality healthcare.
- That the plan of care and treatment plan, the “baton,” is the engine through which the knowledge and power of the healthcare team is transmitted and sustained.
- That the means of transfer of the “baton” which has been developed by the healthcare team is a coordinated effort between the provider and the patient.
- That typically the healthcare provider knows and understands the patient’s healthcare plan of care and the treatment plan, but that without its transfer to the patient, the provider’s knowledge is useless to the patient.
- That the imperative for the plan - the “baton” - is that it be transferred from the provider to the patient, if change in the life of the patient is going to make a difference in the patient’s health.
- That this transfer requires that the patient “grasps” the “baton,” i.e., that the patient accepts, receives, understands and comprehends the plan, and that the patient is equipped and empowered to carry out the plan successfully.
- That the patient knows that of the 8,760 hours in the year, he/she will be responsible for “carrying the baton,” longer and better than any other member of the healthcare team.
It must be remembered that when a patient leaves the hospital, until they are seen in the office or home, the provider team member who is in charge of the patient's care is the patient or a family member. Therefore the baton must be successfully passed to the patient, if the coordination, integration, and continuity of care are to be maintained.
|
The Analytics
To successfully achieve and sustain reductions in readmissions, healthcare organizations must track, audit, and analyze the data.
Care Transition - in June, 2009 the AMA released the "PCPI Care Transitions measurement set". This transition audit is one of the tools used to "build" the "baton" and then to make sure that the complete "baton" has been transferred to the next team member.
|
|
Preventing Readmissions: Lessons to Date
What we have learned so far about decreasing readmission rates is:
- The disease-management model-of-care will not solve this problem. Healthcare providers can’t see patients often enough, give them enough medications, or do enough procedures on them, to effectively reduce readmissions and/or to sustain any reductions which are achieved.
- Care, even within the same organization or system, is still too fragmented to effectively achieve reductions in readmissions. Team building and learning how to effectively use teams are key to this process. SETMA’s current, active effort is to create a “team spirit and collaboration” between four SETMA departments which are working extraordinarily well individually but which are experiencing barriers to a full, integrated, team approach between departments.
- Analytics will be an important part of discovering leverage points for the improving of readmission rates. SETMA has deployed Business Intelligence analytics for that purpose. Because health deteriorates, and on an individual basis and on organizational level, methods must change to respond to that deterioration; it is imperative to continue to redesign the readmissions-reduction effort to keep pace with new realities.
- There is no “silver bullet” for solving the problem of readmissions. A multi-pronged effort will gradually improve readmission rates, until it is suddenly apparent that the system is working. Research will be required to determine the percentage contribution of each element to the success of the effort.
Readmissions rates will always be a challenge. They can be managed effectively with a system such as the one used at SETMA. More details on this system are available under Your Life Your Health by accessing the icons entitled Care Transitions and Care CoordinationHere are additional lessons we have learned in this process.
- The problem of readmissions will not be solved by more care: more medicines, more tests, more visits, etc.
- The problem will be solved by redirecting the patient’s attention for a safety net away from the emergency department.
- The problem will be solved by our having more proactive contact with the patient.
- The problem will be solved by more contact with the patient and/or care giver in the home: home health, social worker, provider house calls.
- The problem will be solved by the patient and/or care giver having more contact electronically (telephone, e-mail, web portal, cell phone) with the patient giving immediate if not instantaneous access.
Readmission rate will be reduced with a Seamless Collaboration Between these members of SETMA’s healthcare team:
- Hospital Care Team
- Care Coordination Department
- I-Care (Nursing Home) Team
- Healthcare Providers
- Clinic Staff
- Hospital In-Patient Staff
SETMA’s most recent development in this quality initiative is that when a person is identified as a high risk for readmission, SETMA’s Department of Care Coordination is alerted. The following ten steps are then instituted:
- Hospital Care Summary and Post Hospital Plan of Care and Treatment Plan is given to patient, care giver or family member.
- The post hospital, care coaching call, which is done the day after discharge, goes to the top of the queue for the call - made the day after discharge by SETMA’s Care Coordination Department. It is a 12-30 minute call.
- Medication reconciliation is done at the time of discharge, is repeated in the care coordination call the day after discharge and is repeated at the follow-up visit in the clinic.
- MSW makes a home visit for need evaluation, including barriers and social needs for those who are socially isolated.
- A clinic follow-up visit within three days for those at high risk for readmission.
- A second care coordination call in four days.
- Plan of care and treatment plan discussed with patient, family and/or care giver at EVERY visit and a written copy with the patient’s reconciled medication list, follow-up instructions, state of health, and how to access further care needs.
- MSW documents barriers to care and care coordination department designs a solution for each.
- The patient’s end of life choices and code status are discussed and when appropriate hospice is recommended.
- Referral to disease management is done when appropriate, along with tetehealth monitoring measures.
Currently, SETMA’s determination of whether patients are high risk for readmissions is intuitively determined, i.e., at discharged based on experience and judgment, a patient is designated as potentially high risk for readmission. SETMA is designing a “predictive model” for identifying patients at high risk for readmissions and instituting the above plan for interdicting a readmission. This is an attempt to quantify the most effective opportunities for decreasing preventable readmissions.
There is a significant body of science associated with “predictive modeling.” It is clear that tradition models of care delivery will not “work” in a sustainable program for decreasing readmissions. Traditional disease management will not result in changing the patterns of care.
|