|
On March 30, 2012, I gave a presentation to the Massachusetts Medical Society, entitled, The Importance of Data Analytics in Physician Practice. (see: http://jameslhollymd.com/Presentations/The-Importance-of-Data-Analytics-in-Physician-Practice; a modification of this address was presented at Grand Rounds at the University of Texas Health Science Center, San Antonio, July 15, 2015 in a different format, see: http://jameslhollymd.com/Presentations/setmas-automated-team-function.)
In Boston, there were three speakers, each had an hour to speak and I was the last speaker. The first speaker asked, “How many tasks can you get a healthcare provider to perform at every patient encounter?” A vigorous discussion ensued at the end of which the speaker said, “I think you can get providers to do one thing.” As the last speaker, I began by saying, “I would like to answer the first speaker’s question, but to do so, you must first answer the following questions”:
- How important is the task you are asking providers to do?
- How much time does it take?
- How much energy does it take?
If you were to create a formula to represent this process, there would be a direct correlation between how many tasks a provider can or will do and how important the tasks are; the more important the tasks, the more tasks a provider will do. There would be an inverse relationship between how much time it takes and how many tasks will be done; the more time it takes, the fewer tasks will be done. There would also be an inverse relationship between how much energy it takes and how many tasks will be done; the more energy it takes, the fewer tasks will be done.
The key to getting more done is to determine what is important and only to do that, and then to make the completion of the important tasks require less energy and less time. Let me illustrate. The Texas State Health Department’s Reportable Conditions illustrates the standardization and the automation of parts of healthcare processes. Remember Peter Senge’s statement in The Fifth Discipline: “The more complex a problem is, the more systemic the solution must be.”
Conclusion:
After the below discussion, which shows that with electronics, many complex and important tasks can be reduced to one second, or no seconds, with little energy expenditure, In he Boston discussion, I concluded: it is possible to get providers to do thirty or forty things every time they see a patient and at SETMA we do.
Illustration One: Reportable Infectious Diseases or Chronic Diseases
How can healthcare providers design a solution to a complex healthcare problem, particularly when the problem is not generated by a patient’s request but by a public-health need? In the former case, the provider simply determines if the request is appropriate or not. In the latter case, no one is in the provider’s office requesting a service; a requirement has been established and it is up to the provider, in the midst of many other demands, to remember and to fulfill the requirement. In the case of infectious diseases, requirements have been published for providers to report the occurrence of dozens of conditions.
Process Analysis: A Systems Solution to the Problem of Reporting
| Problem: | The medical literature is filled with reports of a very low compliance of physicians with reporting infectious diseases to State Health Departments. In Texas, there are 78 infectious diseases which require reporting. The window for reporting compliantly varies from immediate, to one working day, to one week, to ten days, to one month. It is improbable that many healthcare providers know the entire list or the requirement for reporting. The Department of Health wants the report to be triggered by a suspicion and not by a confirmed diagnosis. If the provider waits until the confirmation is made, the opportunity for a public health intervention is lost. |
| Solution: | A systems solution would be best. The ideal solution would be an electronic medication record (EMR) system in which the reporting action is triggered by the documentation of the diagnoses in the assessment in the EMR. |
| Scenario: | On April 30, 2011, Dr. Holly made a presentation for a CME program at Texas A&M College of Medicine. The lecturer who followed him was Dr. Edward J. Sherwood, who lectured on “The Ethics of Infectious Disease.” Dr. Sherwood distributed a publication of the Texas State Health Department which detailed the 78 reportable conditions. |
SETMA’s IT Department was charged with designing a functionality which would:
- Display the reportable conditions for provider review
- Detail the time frame in which each infectious disease should be reported.
- Denote on the display of the reportable conditions the infectious disease which is identified by the provider. This would be done automatically when the diagnosis is documented on the assessment template in the EMR.
- Simultaneous with number three, a telephone message would be sent to SETMA’s Care Coordination which would then make the call or send the fax to report the infectious disease. The fact that this had been done will be stored in the EMR in a searchable fashion.
SETMA’s IT Solution for Reportable Conditions
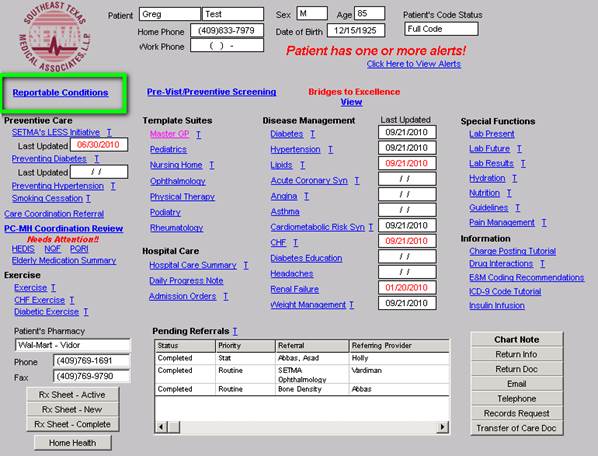
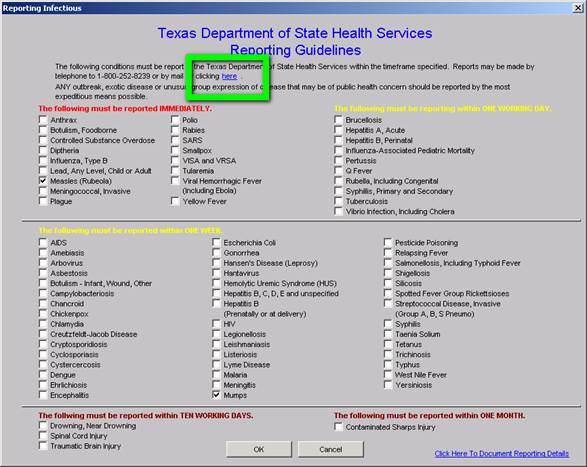
On SETMA’s AAA Home template, which is the place on all care begins, there is a new button entitled Reportable Conditions. It can be seen below outlined in Green.
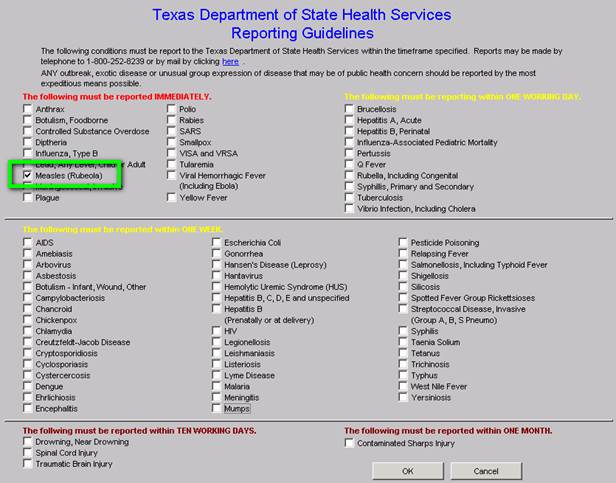
When this button is deployed the following template appears. The template can be used as a review for providers or nurses of what needs to be reported and/or to note that the diagnosed infectious condition, in this case “measles,” has been automatically checked as a result of the provider having selected this diagnoses on the assessment template.
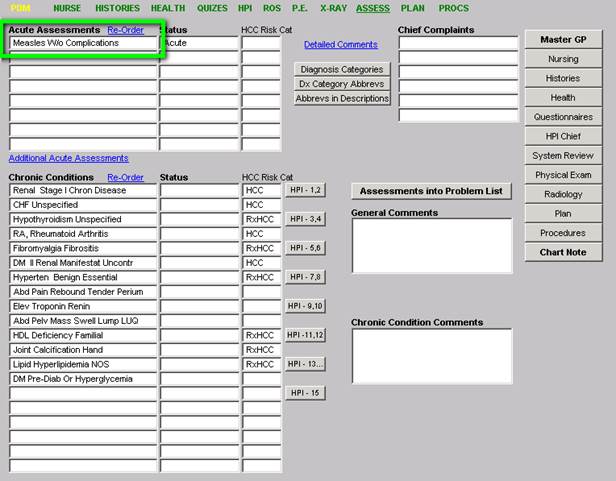
The above checking off of “measles” was noted automatically when the ICD-9 and soon to be ICD-10 code was selected by the provider as is seen below. (Clinicians will amuse themselves with the co-morbidities denoted in this selected “test” patient. It is generally not the case to find measles in patients with diagnoses which are probably from an elderly patient.)
When the infectious disease diagnosis is selected, the system:
- Automatically checks the diagnosed infectious disease on the list of infectious disease
- A telephone message is sent to SETMA’s Care Coordination Department.
- The call notification appears in the workflow of the Care Coordination team.
- Once the report is made a note is added to the patient’s chart noting that Health Department notification has been done.
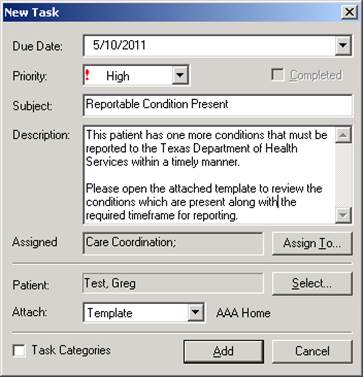
The following is the Care Coordination telephone alert:
At this point, the process is complete. The entire responsibility of the provider is to make the presumed diagnosis. The remainder is done by a systems protocol which is automatic. We expect this to increase the reporting of infectious disease by SETMA to almost 100% thus improving individual patient care, community care and public health.
Addendum
If you click the link circled below, it will automatically launch the form if you chose to do the report by mail.
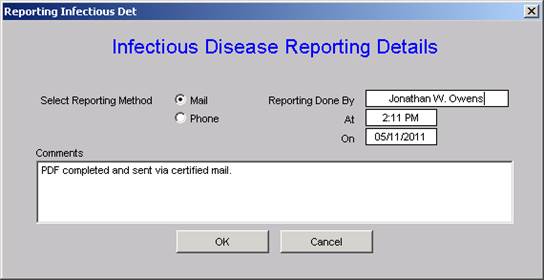
When the Care Coordination department reports the infection, the following allows for the documentation of that report.
Auditing
Quarterly and annually, SETMA will create the following audits:
- How many infectious diseases were documented as having been suspected by providers in the practice? These will be categorized by each of the 78 reportable conditions listed above.
- How many infectious diseases were reported to the appropriate health agency?
- How many of each infectious diseases were reported within the designated time frame?
- If a confirmatory test was performed, what percentage of the report conditions were proved to be present?
This material will be an ongoing quality improvement project by SETMA.
This is a simple but elegant electronic solution to a complex problem which has never been completely solved in healthcare provider workflow. It requires no time on the part of the provider. It is measurable and it is sustainable. Since SETMA designed this solution, several issues have arisen which were unanticipated.
- Does the Department of Health want previously reported incidences of chronic infectious diseases such as hepatitis and HIV to be re-reported?
- Does the Department of Health want infectious diseases previously reported in other states reported when the patient moves to Texas?
- Does the state have a way of determining that a chronic infectious disease has been previously reported or not?
- In regard to EMR solutions, the diagnosis of "Coumadin Toxicity" is reported as an "overdose." Obviously, this is not the intent of the desire for public health officials to know the incidence of narcotic or psychotropic drug overdoes. The power of electronics has to be guide so as not to report conditions not intended to be reported.
It is probable that as we proceed, other issues in reporting infectious diseases will arise. The good news is that the above issues have not been considered previously and decisions are being made as to what the answers are. We are all learning and with electronics, we are all participating in improving the care Texans and Americans are receiving.
If an important task is not being done either because the provider is resistant to doing it, or because the provider has “too much” to do, automate it. (Remember the Maginot Line)
Summary of This Solution in the Context of our Three Questions
- How much time does it take the provider to complete this reporting? None
- How much energy does it take the provider to complete this reporting? None
- How important for pubic health is this reporting requirement? Very important
- How effective is SETMA’s solution? Perfect reporting is continuously achieved
Illustration Two: Framingham Risk Scores
A second process analysis illustrates the power of electronic solutions to complex problems in healthcare. In August, 2010, the American Academy of Family Practice Journal recommended that every family physician calculate one Framingham Risk Score for each of their patients every five years.
The Framingham Study which began in 1949 is the longest running longitudinal health risk study ever undertaken. "Longitudinal" means that the same subjects are included at all stages of the study. There are weaknesses to the study. Often the Cardiovascular Risk calculators overestimate a person's health risk and because total cholesterol was the principle lipid element measured when the study was started, the data does not assess the risk of Low Density Lipoproteins (LDL, which is the "bad cholesterol)." We now know that controlling your LDL is the most important issue related to lipids and health risk.
Why do we use Framingham Heart Study Risk Calculators?
Even though these risk calculators are not perfect, they are still the best we have. And, it is imperative that you know and that your provider knows what your risk is, because it is with the knowledge of your risk that a plan of care and a treatment plan can be designed to help you preserve your health. Remember, "risk" is an attempt to determine what the future might be like which means it is imprecise. Some people with a high risk will not experience poor health and some who have low risk will. Overall, however, those with high risk will have more heart attacks and strokes than those with low risk.
Dynamic Complexity
The problem with biological systems is that change, even change which results in deterioration of your health, does not occur quickly and it often occurs without any signs or symptoms until the illness, or disease process has already caused significant damage. There is no explanation of this principle more apt to our use of "risk calculators" than Peter Senge's explanation of "dynamic complexity" in The Fifth Discipline.
Senge defines "dynamic complexity" as a situation "where cause and effect are subtle, and where the effects over time of interventions are not obvious." This perfectly describes the development of many disease states and the benefit of their treatment. We know that obesity causes, or contributes to most diseases including type 2 diabetes, hypertension, heart disease, cancer, etc. In these conditions, "obesity" is the cause; "cancer" is the effect, but the change is slow and is not apparent. Also, the results of treatment are very slow. Consequently, it is hard to sustain the changes necessary to eliminate the "cause," which is obesity, in order to avoid the "effect" which is cancer.
Shifting the Burden
There are structural problems which aggravate the obvious solutions to a business or a health problem; Senge addresses one of these and calls it "the shifting the burden." He defines "shifting the burden," as "an underlying problem generates symptoms that demand attention. But the underlying problem is difficult for people to address, either because it is obscure or costly to confront. So people 'shift the burden' of their problem to other solutions - well intentioned, easy fixes which seem extremely efficient. Unfortunately, the easier 'solutions' only ameliorate the symptoms; they leave the underlying problem unaltered. The underlying problem grows worse, unnoticed because the symptoms apparently clear up, and the system loses whatever ability it had to solve the underlying problem."
This happens in healthcare when a person looks to healthcare providers or medications to solve a problem which can only be solved by their own habits, choices, decisions and resolution. A pill, or a procedure, or a prescription is sought in order to overcome the "obesity." It will work for a short while but not long term. When it fails, more aggressive interventions are tried without addressing the fundamental problem.
The Quick Fix Deception
Senge's business prescription is a good one for healthcare, also. He says, "Beware the symptomatic solution...that address only the symptoms...not fundamental causes, tend to have short-term benefits at best. In the long term, the problem resurfaces and there is increased pressure for symptomatic response. Meanwhile, the capability for fundamental solutions can atrophy." (p. 104) Senge adds, "The 'easy solution...the 'quick fix'...solves the problem temporarily....(but) a shifting of burden structure lurks behind many 'solutions (and) explains a wide range of behaviors where well-intentioned 'solutions' actually makes matters worse over the long term." (p. 107)
Senge and Medicine
The longer a person delays addressing the "real" cause of their problem, the fewer options and the fewer resources they have for dealing with the "real" cause of the problem. For instance, the longer a person fails to exercise, often resulting in gaining weight and diminishing heart function, the more difficult effective solutions will be once a person determines to improve their health. If a person continues to "shift the burden" of their own irresponsibility to another, expecting an artificial solution to relieve the burden created by the rejection of the real solution, they will never achieve their goal. In this case, the harder the patient pushes for solutions from a healthcare system which cannot solve their problem, for which a natural and obvious solution exists, the less benefit the patient will achieve. It is possible to ignore the real solutions - i.e., activity such as walking - until the knees and other joints have deteriorated and it is not possible to become active. In that case, more and more pressure is placed on the artificial system with less and less satisfaction with the results.
Risk Calculators: Dynamic Complexity and Shifting the Burden
These are the reasons for our using "risk calculators." Because in a biological system proving the benefit of fundamental solutions by waiting for the negative consequences of poor health choices is not acceptable, we use "risk calculators" to project what those poor choices will lead to. Hopefully, those risk calculators will help you make a decision to make a change. The American Academy of Family Practice (AAFP) recommends that a healthcare provider calculate these risk factors every five years for their patients. By accessing Cardiovascular Risk Calculators by Alan E Leifeste, you will be able to read Dr. Alan Leifeste's letter to the AAFP about SETMA's use of Framingham Risk Calculators.
More Information Found at www.jameslhollymd.com
The details of each of the risk calculators including the elements of your health used in calculating each score can be found on SETMA's website (www.jameslhollymd.com) under "Electronic Patient Management Tools" by clicking on "Framingham Cardiovascular Risk" and then accessing "Framingham Cardiovascular and Stroke Risk Assessment Tutorial." In addition, at our website under "Your Life Your Health", twenty-two articles can be found under "View Articles by Subject" and accessing "Cardiovascular Disease Risk Factors."
What If?
Because it takes SETMA only one second (really) to calculate all twelve risk calculators, we thought we were doing great. However, when we showed this function to Dr. Richard Jackson commented that these scores overstate the risk and Dr. Kenneth Snow asked if we could show the patient how their risk would be affected if they make a change in their habits? Sadly, we had to admit that we could not. That was on Tuesday. November 30, 2010.
We realized that while the patient has to know their risk, to understand "dynamic complexity" and its dangers for their ignoring their health until it is too late, and to avoid "shifting the burden" of responsibility from themselves to another, their healthcare providers have a responsibility to show them that if "they make a change that it will make a difference."
Facts:
- There are 12 Framingham Risk Scores
- To turn these scores into a tool for challenging patients with the premise, “If you make a change, it will make a difference,” you can add “What If Scenarios” to each
- But now you have 72 computations
- Can you get a provider to do all of these scores at every visit?
Remember our three questions: How important is it; how much time does it take; how much energy does it take? With electronics, we can make it easier to do it right than not to do it at all. Depending on the method, it can take 10 to 200 minutes to make these 72 computations, but with electronics the time can be reduced to one second. With team work, the time and energy on the provider can be reduced to zero.
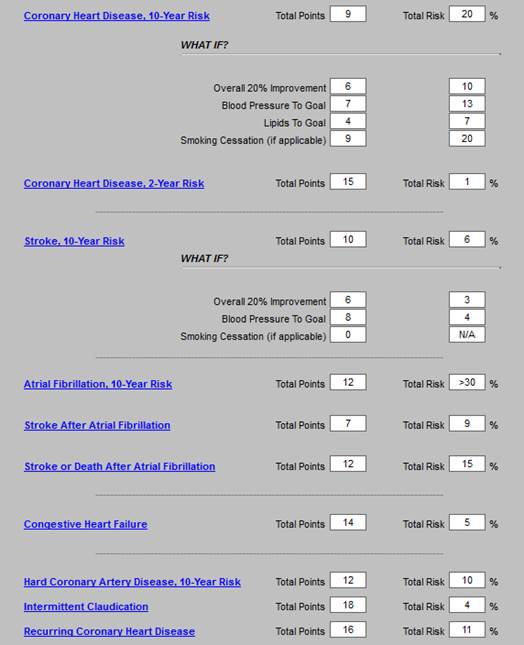
The General Cardiovascular Disease 10-Year risk
This score projects the probability of a person having a major cardiovascular event such as a heart attack or stroke in the next ten years. The above patient‘s real heart age is 54 years but the relative heart age is 76 years (his health is deteriorating more rapidly than he is aging), and the 10 year risk is high at 25.3%. These are very discouraging number for a 45 year old man. But now that we have added the -What If? section, we can assure this man that if he will make a change, it will make a difference. In addition, the greatest opportunity for improvement in his risk is indicated by the change in risk with each of the scenarios below.
- If he changes all of the elements in this calculation which are changeable (systolic blood pressure, cholesterol, smoking, hypertension treatment), his risk will improve. The unchangeable features are age, gender and diabetes.
- If he changes all of the elements to -evidenced-based goals, his risk will drop to 9.4% and his -relative heart age will drop from 80 to 54. These are dramatic improvements in his risk. We can categorically assure him that -if he makes a change, it will make a difference.
- If he changes all of the elements by a 20% improvement, his risk will drop to 15.6% and his -relative heart age will drop to 64. Obviously these are not as good as the result of treating him to goal, but they are significantly improved.
- The changes for treating his blood pressure to goal without affecting the other elements shows a drop in risk as does changing the cholesterol. There is no improvement for smoking cessation in that it is noted that this patient does not smoke.
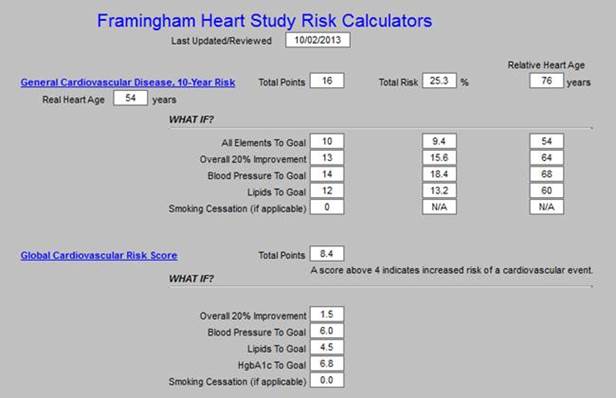
The second risk score is the Global Cardiovascular Risk Score, which is technically not a Framingham Calculator, bit which was derived from the Framingham Data. It was developed in order to eliminate the unchangeable features such as gender and age which are so heavily weighted in the Framingham Calculators so that many young people with significant risk are overlooked and many elderly people with lower risk are still rated at a very high risk. In addition, while others of the calculators take into consideration whether the patient has diabetes or not, as diabetes is an independent risk factor for heart disease, the Global Cardiovascular Risk Score takes into account whether patients with diabetes are well controlled, or not, as is indicated by the hemoglobin A1C (HbA1c).
The elements in this score are HDL, Systolic Blood Pressure, HbA1C, packs per day smoking and total cholesterol. As can be seen, if all of these elements are treated to goal, the risk goes from 13.9 points to 0.5 points. It is possible to get some indication of the contribution of each element to the risk by seeing how the risk changes when only one of the elements is changed such as blood pressure, lipids or HbA1C. As is suggested by this review, the most important thing to control is your blood pressure.
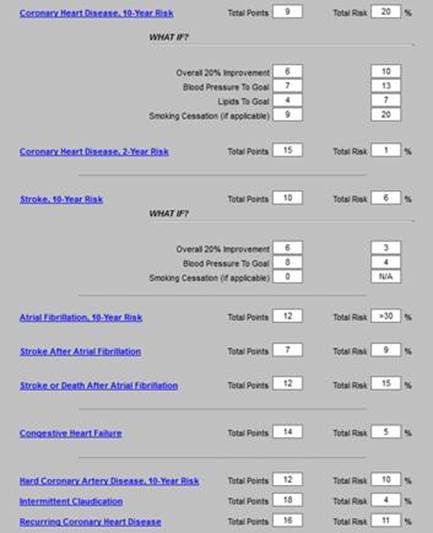
Stroke Risk - What IF?
The final calculator for which the -What If? scenarios have been calculated is -stroke risk, which is shown on the template below. The elements of this calculator are:
- Age 55-84
- Systolic blood pressure
- Diabetes mellitus
- Cigarette smoking,
- Prior cardiovascular disease (CHF, MI, Peripheral Vascular Disease, Angina)
- Atrial fibrillation
- Left ventricular hypertrophy
- Use of hypertensive medication
The current calculation of 16% risk is shown and the improvement with each scenario is displayed. Of interest is that simply controlling the blood pressure achieves almost all the possible improvement, i.e., from 16% to 5%. And, there is no difference between a -20% improvement and -a treatment to goal, demonstrating that it is not necessary to be perfect in order to achieve significant improvement; said another way, -If you make a change - even a small change -- it will make a difference.
Plan of Care and Treatment Plan
If a patient is going to make a change which will make a difference, there must be a basis on which change can be expected. We know that conversations at the time of an office visit are part of that decision to make a change. However, without a written, personalized plan of care and treatment plan, few patients will successfully make those changes and sustain them.
The -WHAT-IF? Scenarios described above will be added to patients‘ diabetes, hypertension and/or lipid plans of care and treatment plans. These documents are the -batons which are passed from one member of the healthcare team - your healthcare provider - to another member of the team - the patient. If the patient will study these documents, we believe it will encourage them to make changes and it is our confidence that those changes will make a difference. With the patient‘s name and personal data in each plan, the probability of their studying the material is greatly increased.
SETMA Tutorial For Use of Framingham Risk Calculators (the full 31-page tutorial can be found at http://jameslhollymd.com/EPM-Tools/pdfs/framingham-tutorial.pdf).
The SETMA Framingham Heart Risk Calculators can be found on the following Disease- Management Master Templates: Diabetes, Lipids, Hypertension, CHF, Acute Coronary Syndrome . and Chronic Stable Angina
This is an illustration taken from the Lipids Disease Management Tool:
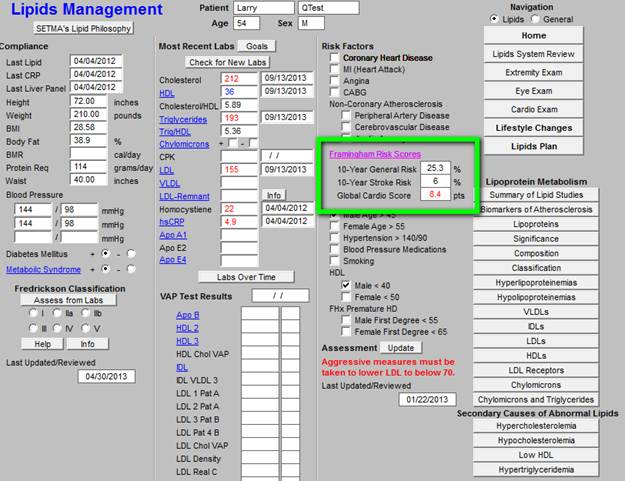
The three major Risk Score results - 10-Year General Cardiovascular Risk, 10-Year Stroke Risk and the Global Cardio Score -- are displayed on each master templates. When the button entitled Framingham Risk Scores is depressed on any of the above named master templates, the Framingham Heart Risk Calculator is launched. Without any other action on the provider‘s part, all twelve calculations are made. All data points are aggregated electronically for this purpose.
The following is the template which appears when the button entitled Framingham Risk Scores is depressed. It will be noted that the titles of each of the risk calculators is in blue. This means that each is a hyperlink and when depressed the elements on the basis of which the score is calculated is displayed.
This function is a useful teaching tool, as it possible to review these elements with a patient when any score is being discussed. This will be a useful means of alerting patients to the changes they need to make in their lifestyles or treatment regimens in order to moderate their risk. The date that the Framingham Risk Scores were calculated and reviewed is noted at the top of the template.
The remainder of this tutorial will be a review of the elements of each of the risk scores with an introductory statement for each, taken from the Framingham official website at www.framinghamheartstudy.org, followed by SETMA‘s display of the risk elements when the hyperlinks above are launched.
The Value of Framingham Calculators
In August, 2010, the American Family Physician (reference: Global Risk of Coronary Heart Disease: Assessment and Application, Anthony J. Viera, MD, MPH and Stacey L. Seridan, MD, MPH, University of North Carolina at Chapel Hill School of Medicine, Chapel Hill, North Carolina Am Fam Physician. 2010 Aug 1;82(3):265-274) made the following observations:
-Coronary heart disease is the most common cause of death in the United States. The conventional risk factor approach to primary prevention excludes many patients who could benefit from preventive therapies. A global risk approach allows more accurate estimates of risk to guide clinical primary prevention efforts. Global risk of coronary heart disease is a calculation of the absolute risk of having a coronary heart disease event (e.g., death, myocardial infarction) over a specified period. It is based on an empiric equation that combines major risk factors, such as blood pressure and cholesterol levels. When physicians know a patient‘s global risk of coronary heart disease, they are more likely to prescribe risk-reducing therapies such as antihypertensives, statins, and aspirin. In addition, patients who know their risk level are more likely to initiate risk-reducing therapies. Many tools are available to estimate global risk, including several Web- based calculators. In the United States, tools based on the Framingham Heart Study are recommended.
The Automated Team (see: http://jameslhollymd.com/epm-tools/Automated-Team-Tutorial-for-the-EMR-Automated-Team-Function) - this link is to a tutorial for “The Automated Team”
These two illustrations are the foundation of what has come to be known as SETMA’s “automated team.” With automation, we can imitate Henry Ford, who automated the manufacturing of automobiles with assembly lines and in so doing made it possible for those who made cars to afford to drive them. There are many aspects of patient care which can be automated.
Classically, SETMA has used clinical decision support as reminders to providers, but now we are realizing that many of the tasks which were the object of CDS, actually could and should be automated, requiring no input from the provider. For instance, the value of the flu immunization is not enhanced by it being ordered by a healthcare provider, or by it being given by a registered nurse. And, the process of a flu immunization can be automated.
In June, 2013, the American Medical News published an article entitled, “Serious work put into making primary care fun again.” With an anticipated serious shortage of primary care physicians over the next twenty years, the article addressed how to improve the lot of primary care providers, stating in part: “Amid alarming rates of physician burnout, hundreds of clinics nationwide are redesigning their practices with a goal in mind beyond improving the quality of care. They are aiming to make life as a primary care doctor enjoyable once more. Twenty-three of these clinics...describe practice innovations that can ease the chaos, administrative overload, miscommunication and computerized busy work that too often characterize primary care.”
In 1993, John Patrick set IBM on another course and changed the company's future. Reading his story made me wonder, is it possible for SETMA to set medicine on another course and to change the future. John did not want people to work “collaterally,” side by side, maybe going in the same direction, maybe even having the same goal, but working independently and at best in a cooperative manner; he wanted people to work “collaboratively,” synergistically, leveraging the generative power of a team in creating a new future which they partially envision but which even they could not control.
What can we do today in healthcare which would mirror the changes IBM experienced? How can we change “collaterallists” into “collaborativists”? How can we use the power of electronics, analytics, and informatics principles to energize radical change to create a new future in healthcare? Testing and measurement is a science. In most industries, quality is determined by testing performance.
James (Larry) Holly, M.D.
C.E.O. SETMA
www.jameslhollymd.com
Adjunct Professor
Family & Community Medicine
University of Texas Health Science Center
San Antonio School of Medicine
Clinical Associate Professor
Department of Internal Medicine
School of Medicine
Texas A&M Health Science Center
|