|
Today, May 2, 2011, SETMA's CEO, Dr. Holly, and Managing Partner, Dr. Aziz, leave for Los Angeles to attend the Gartner Business Intelligence Summit. As SETMA is a semi-finalist in the Gartner Awards, Dr. Holly, will present SETMA's deployment of the IBM Business Intelligence (BI) software, COGNOS. Last week, in Austin at the Regional HIMSS meeting and in College Station at the Texas A&M School of Medicine, Dr. Holly presented SETMA's use of COGNOS.
During the drive from Austin to College Station on Friday, Dr. Holly conducted a one-hour conference call with seven IBM executives to discuss a new initiative which IBM is working on called, "What is your AQ, or Analytics Quotient." Of this, IBM said, "We are promoting how our best customers use business analytics to extend the value of their information, gain new insights, increase collaboration and in some cases understand risks. These are companies where senior and executive management is engaged in utilizing this information to improve their operations, extend visibility and drive profitability. Following is a maturity model to give you a bit more information on the Analytics Quotient journey to improved performance."
The steps or stages of AQ development and the use of analytics are:
- Step I Aspirational -- Tactical, bottom-up focus. Individual functions. Gut feel vs. fact driven. Historical view, based on the last business cycle. Minimal technology adoption, "spreadsheet hell". Concerns with data quality.
- Step 2 Experienced -- Integrated view across separate teams within a department. Historical and current view. Trending over past and future time periods. Ability to drill down to greater levels of detail. Data is standardized in pockets, but overall data ownership is unclear.
- Step 3 Leaders -- VP-level accountability Defined operational and financial metrics across more than one dept. Historical and current views are leveraged as context and understanding to establish a future view of opportunity and risk. Data from transaction systems is not sufficient. Data from text, point of sale, RFID, social media etc, is combined for a cohesive view.
- Step 4 Masters-- Top-down goal setting and resource allocation is integrated into daily operations. Everyone knows the priorities and how they can collaborate across the organization maximizing outcomes and reducing risks to achieve them. Decision-makers across the board have the information they need at their fingertips including recommendations and automated decisions where needed. Data Governance is in place
The following is one of the conference-call participant's responses to that discussion:
"You dazzled them! I was already impressed with (SETMA's) story and am every time I read it or hear it. You are definitely building a big fan club and following with the IBM family. THANK YOU, Dr. Holly, for taking the time to speak with us and for all your much appreciated support!!!!!! Kelsey will take what she captured today, as well as glean from the SETMA story and likely get a write-up to you soon on what we'd like to share on our web site and as we launch our analytics quotient buzz. You are definitely too modest about what SETMA has accomplished in your journey to performance improvement. Though there may be much you would yet like to do, you're already way ahead of many and definitely deserve the recognition and awards you have earned. Yours is a fabulous and inspiring story indeed!"
SETMA's AQ is well along the continuum and is somewhere between "leaders" and "masters." As we grow and learn, our AQ will grow as well. We have started and we have started well, but in the future, we will be better than we are.
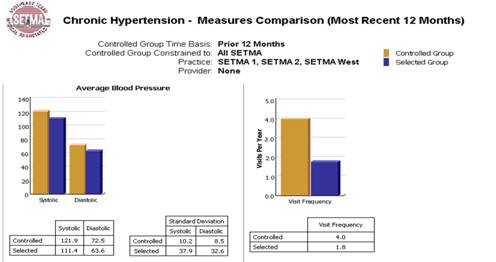
SETMA's Use of BI in Hypertension
The following are a few examples of the auditing SETMA does of provider performance. The first audit below looks at patients with high blood pressure. The gold bars are the patients who are treated to goal and the purple are ones who are not. In the right hand column, patients are evaluated as to how many visits they had. It is easily seen that those who are treated to goal have 4 visits in the past twelve months and those who are not to goal had 1.8 visits. This is a statistically significant difference which leads to the conclusion that one of the ways to improve the care of those who are not to goal is to see them more often. Without the BI audit, we would never have know this.
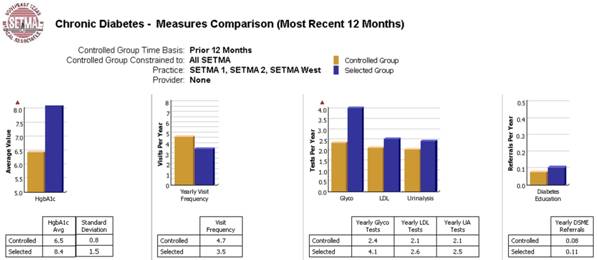
SETMA's Use of BI in Diabetes
Through BI audits, SETMA is able to display outcomes trending which can show seasonal patterns of care and trending comparing one provider with another. It is also possible to look at differences between the care of patients who are treated to goal and those who are not. Patients can be compared as to socio-economic characteristics, ethnicity, frequency of evaluation by visits and by laboratory analysis, numbers of medications, payer class, cultural, financial and other barriers to care, gender, and other differences. This analysis can suggest ways in which to modify care, in order to get all patients to goal.
Using digital dashboard technology, SETMA analyzes provider and practice performance in order to find patterns which can result in improved outcomes, practice wide, for an entire population of patients. Data is analyzed by patient populations, provider panel, practice panel, financial class €“ payer, ethic group, and by socio-economic groups.
An analysis of the graft below shows the standard deviation for patients with diabetes treated to goal of .6 which is ideal but of 1.5 for those who are not treated to goal. This standard deviation is improved from 2000 when it was 1.98, as an aggregate of all patients with diabetes. In the audit below, the cut-off for treated-to-goal displayed in gold is an HbA1c of 6.5%.
The visit frequency is marginal but is a leverage point for change and the frequency of performing a HbA1c shows no opportunity as the patients treated to goal are tested 2.4 times a year and those not at goal are test 4.1 times per year. The frequency of referral of patients to Diabetes Self Management Education (DSME) is very low. As a result of this analysis, SETMA has designed a new method for alerting all SETMA providers to make sure that their patients go to diabetes education classes.
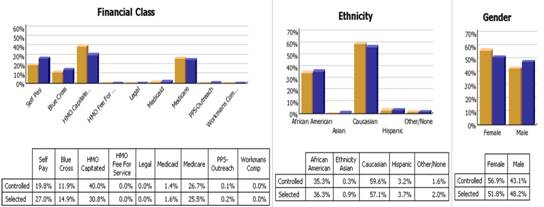
In the following audit, financial class of insurance, ethnicity and gender are examined. From this data, it is shown that there is no difference in the treatment of African American and Caucasians. Also, it shows that HMO Capitated patients are actually receiving better care than patients with other forms of insurance.
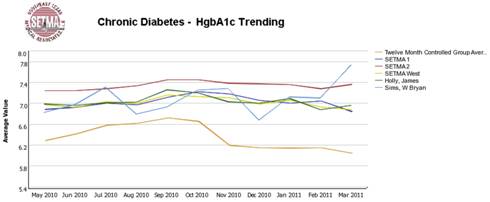
One of the most power auditing tools is trending which allows over-time patient results comparing: provider to practice, provider to provider, provider current performance to provider over time and trending of results to see seasonal changes. In a prior analysis of the period January 1, 2009 to December 31, 2009, the trending showed that beginning in late October many patients with diabetes began losing control. This led to further analysis which showed that not only did the holiday season (Halloween, Thanksgiving and Christmas) result in an upward trend of HbA1c but the patients who were losing control had fewer visits and less testing during that is period. In 2010, a quality improvement plan was put into place where all patients with diabetes were contacted by mail and telephone. A contract was established with each patient for dietary control, activity, clinic visit and testing. The below audit shows that in the November and December, 2010 period, that loss of control did not occur.
Encouraging Patients that if they make a change it will make a difference
In addressing "clinical inertia, the tendency for healthcare providers not to make a change in care even when a change is needed, SETMA realized that the same inclination not to change existed in patients as in providers. When healthcare providers asked patients to make a change in their lifestyle, they are entering into a "bargain," which argues that, "if you make a change, it will make a difference." Often this does not resonate in populations which have no personal experience with changes that made a difference in their life.
Employing the Framingham Risk Calculators, SETMA not only calculates the twelve risk scores at every visit, but also has added a "what if" scenario to the calculation. This tells the patient, "If you make this change, it will make this difference." The following is a screen shot of part of that template. It shows a "what if" scenario for the following events:
- Outcomes are improved to goal.
- Outcomes are improved by 20%
- Blood pressure is improved to goal
- Lipids are improved to goal
- Smoking is stopped
The patient's current risk is shown and the change in the risk with the above changes factored in.
The risk calculations, which take one second to complete, are done by the nurse, but the explanations to the patient are done by the healthcare providers. At the conclusion of the visit, these results are presented as a part of the patient's written plan of care and treatment plan. This allows the patient to review the material and to incorporate the "promised' improvement into their healthcare decision process.
SETMA's Use of BI in Peer Review and Quality Improvement
An average of 8-10 times per year, SETMA closes its offices for a half day and engages all SETMA providers in training, peer review, and quality improvement sessions which last 3-4 hours. The most recent one was conducted on April 28th. During this session, SETMA's Business Intelligence capacity was reviewed in depth with all providers. Its functions and capacities were reviewed and we made sure that all providers know how to access the functions and to create their own BI reports.
All provider performances by name were reviewed by all providers. This was not done to embarrass anyone €“ in fact all SETMA provider performances are good €“ but it was done for all to learn. We all agreed that we would never be offended that someone shows that we are not doing well; we will only be offended if we are unwilling to change and to improve. And, all SETMA providers recognize that if we do not know how we are doing, there is no way we can improve "how we are doing."
In the course of this session, we not only reviewed how we have been doing but we also designed several new functions in our electronic patient records system which will help all providers improve their care in the future. Those improvements and several others which will employ BI are:
- Because we know that many people, even those who do not practice high risk behaviors, still contract HIV and because we believe that everyone has an ethical responsibility to have themselves tested, we have built into our Screening and Preventive Health functions an audit for all patients from 13 years of age to 75 years of age to have an annually HIV screening test. At present, only 1,478 of our patients have ever had an HIV screen. That number will go up drastically over the next several years, largely because of BI.
- Because our BI audits and review showed that many of our patients with diabetes have not been to diabetes education, and because we know that education is critical to success in the treatment of diabetes, we have designed a function on SETMA's Screening and Prevention tool for referring patients with diabetes and/or with pre-diabetes to education classes.
- Because reporting of infectious disease cases such as measles, influenza, etc., is poor in Texas and often take place only after the laboratory confirmation of the diagnoses is received, thus making it impossible for public health to intervene in a timely fashion, SETMA is deploying a new functions which will: (1) Remind providers of reportable illness (2) Remind them of the time frame in which the condition is to be reported, i.e., immediately, one day, 10 days, etc. (3) Create an automatic reporting tool when the diagnosis is suspected.
The future of Business Intelligence in Healthcare
The future of excellence in healthcare is going to involve auditing and analysis of performance by healthcare providers. SETMA has only just begun to realize the benefits from this technology, but we have already experienced significant improvements in care outcomes from it.
|