|
Population Management: identifying leverage points for quality improvement, measurement of provider performance, and transparency
We have already stated that accountability and transparency are the principal reasons for public reporting of our performance, but there is more to accountability and transparency in healthcare than that. We b believe that public reporting of quality performance will change provider and patient behavior. Typically healthcare providers only receive delayed, retrospective reviews of their performance, which does not change behavior significantly, in our judgment. In the Old Testament, a verse declares that "because punishment against an evil deed is delayed, the hearts of men are set upon doing evil." The principle is that without immediacy between the consequences and/or evaluation of an action and the action itself, the potential for the consequence to effect positive change is diminished or eliminated. While auditing provider performance is never for punitive reasons, the principle is the same. If the reporting of the results is significantly removed in time from the events being audited, it will have little impact upon provider behavior.
In his book, The Fifth Discipline, Peter Senge of MIT used the classic metaphor of the Frog in Boiling Water to address the same issue from a different perspective. He explains, "If you put a frog into cool water; he will swim around. If you begin to heat that water, the change is so gradual that the frog will not recognize the danger until it is too late for the frog to escape." The same is true of patients and healthcare providers. Because the changes in patient health are generally very slow and without immediate consequences (symptoms), both provider and patient can become complacent.
The medical literature addresses this complacency with the concept of "treatment inertia," the tendency on the part of healthcare providers to do nothing, even when something should have been done. Most of the research on "treatment inertia" has been done in the medical education arena where it is expected that "best practices" will always be present. There is no intent in this project of punishment, or of boiling anyone in hot water, but the intent is to find a way to change provider behavior and to overcome "treatment inertia." SETMA believes, as is also addressed by Senge, that the only effect way to change patient and provider conduct in the face of chronic conditions which cause no short-term discomfort but which have long-term devastating consequences, is to create discomfort in both in order to overcome "treatment inertia" and/or current apathy toward inevitable bad outcomes.
The Physician Consortium for Performance Improvement (PCPI) is an organization created by the AMA, CMS, Institute of Medicine and others to develop measurement sets for quality assessment. The intent is to allow healthcare providers to evaluate their own performance at the time they are seeing a patient. SETMA is tracking a number of these measurement sets including: Chronic Stable Angina, Congestive Heart Failure, Diabetes, Hypertension, and Chronic Renal Disease Stages IV through ESRD, Adult Weight Management, and Care Transitions. Others will be added overtime. The details of these measurement sets and SETMA's provider performance on each can be found at under Public Reporting PCPI.
In addition to Provider Performance Tracking tools such as those produced by PCPI, the National Quality Foundation (see Public Reporting NQF), and National Committee for Quality Assurance (see Public Reporting HEDIS and/or NCQA), SETMA has designed a pre-visit quality measures screening and preventive care tool. This allows a SETMA provider and a patient to quickly and easily assess whether or not the patient has received all of the appropriate preventive health care and the appropriate screening health care which national standards establish as being needed by this patient.
For an analysis of ethnic disparities, our data for the treatment of diabetes for the past twelve months is as follows:

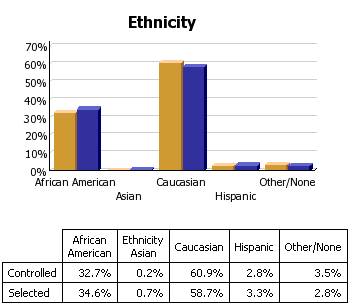
Before the judgment is made that Caucasians receive significantly better healthcare, the bar graph must be described.
- 3783 patients seen by SETMA providers in the past twelve months had diabetes.
- As a percentage of the 3783 patients with diabetes 1,323 were controlled. (For this audit, "controlled" is defined as the patient having had a HgbA1C below 6.5 % for the entire year.) If, as in the case of the National Quality Forum (NQF) Comprehensive Diabetes Measurement Set, "controlled" were defined as below 7% and the measure called for an examination only of the most recent HgbA1C, the percentage of those designated as "controlled" would rise to 59.9%.
- 60.9% of the patients who had diabetes and who were seen in the past twelve months and whose HgbA1c was below 6.5% for the entire year, were Caucasians
- 32.7% of African American treated by SETMA who had diabetes, who were seen in the past twelve months and who had HgbA1C done had a HgbA1C continuously below 6.5%.
- The second classification on this graph is entitled "selected." In the case of the above bar graph, "selected" refers to all patients whose diabetes, at any point in the year, was above 6.5%. There were 2460 of them.
At first glace, it might be assumed that the care of Caucasians was twice as good as that of African Americans. But note that the percentage of "controlled" and "Selected" is not of a subset but a percentage of the same whole. As a percent of the whole, SETMA treats twice as many Caucasians as African Americans. As a percent of those who exhibited continuous control of their diabetes, it is the same proportion of African American as Caucasian. Their treatment judged by process measures or by outcomes measures is identical. The conclusion is that the ethnic distribution of all of SETMA's patients with controlled diabetes is nearly identical to the ethnic distribution of SETMA's patients with uncontrolled diabetes.
- Analytics transform knowledge into an agent for change.
- In reality, without analytics, we will neither know where we are, where we are going or how to sustain the effort to get there.
- For transformation to take place through knowledge, we must be prepared to ask the right questions, courageously accept the answers and to require ourselves to change.
- The greatest frustration to transformation is the unwillingness or the inability to face current reality. Often, the first time healthcare provides see audits of their performance, they say, “That can’t be right!”
- Through analytics - tracking data, auditing performance, statistical analysis of results - we learn the truth. For that truth to impact our performance, we must believe it.
|