|
Final QRUR for the Full Year: 2015
Released on September 27, 2016, this is an analysis of the 2015 Annual Quality and Resource Use Report (GRUR) and the 2017 Value-Based Payment modifier. The full report can be reviewed at: http://jameslhollymd.com/Letters/pdfs/cms-quality-resource-and-utilization-report-qrur-data-for-2015-for-setma-final.pdf.
Mid-Year GRUR for Half Year: 2015
These results can be contrasted with the 2015 Mid-Year Quality and Resource Use Report:
http://jameslhollymd.com/Letters/pdfs/cms-quality-resource-and-utilization-report-qrur-data-for-2015-for-setma.pdf.
Summary of GRUR Results for Full Year: 2014
The 2015 Mid-Year and 2015 Final Year QRUR can be contrasted with the summary from 2014 results which are displayed at: http://jameslhollymd.com/Letters/mips-advanced-care-information-clinical-practice-improvement-pc-mh.
The following is the “scatter plot” for 2015 of a representative sample of other Taxpayer Identification Numbers (TIN):
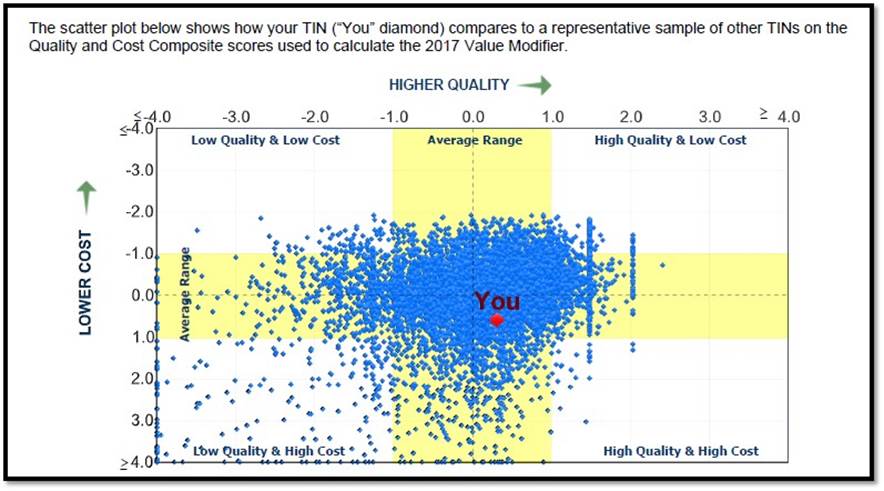
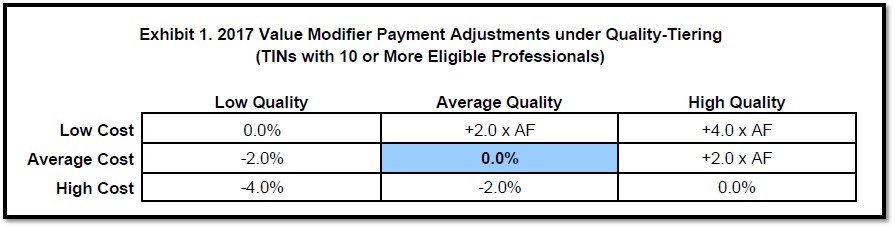
SETMA’s TIN’s overall performance was determined to be average on quality measures and average on cost measures. Therefore, the Value Modifier applied to payments for items and services under the Medicare Physician Fess Schedule for physicians billing under SETMA’s TIN will result in a neutral adjustment, meaning no adjustment (O.0%). All of the options under MACRA and MIPS for Value Modifier Payment Adjustments under Quality-Tiering are seen in the following exhibit.
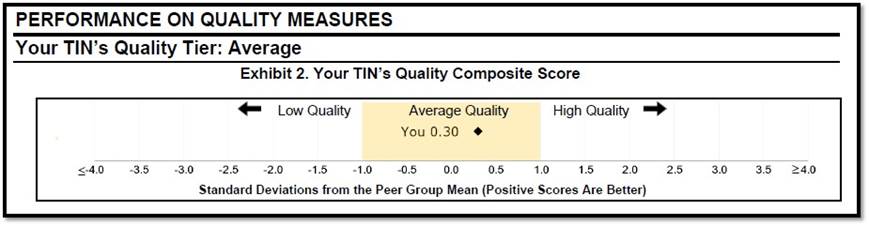
The Range of Average Performance on both the Quality Composite Score and on the Cost/Resource Utilization Score is with a one standard deviation above our below the mean (or average). SETMA’s performance on quality measures is show in the exhibit below to be 0.30 above the mean. In the case of quality higher is better.
It will be SETMA’s goal in 2017 to improve our quality performance to at least one standard deviation above the meant so as to move SETMA into the High Quality quadrants in the scatter plot above and simultaneously to move into the Low Cost quadrant in that scatter plot. This would place SETMA in the Right Upper Quadrant of the scatter plot.
Our plans for doing that are discussed in the document at the following link: http://jameslhollymd.com/Letters/requirements-of-the-medicare-access-and-chip-reauthorization-act, and in other publications on our website.
Effective Clinical Care Domain Quality Indicator Performance for 2015
The 2015 Annual Quality and Resource Use Report (GRUR) and the 2017 Value-Based Payment modifier includes the following Effective Clinical Care Domain Quality Indicator Performance. The full report can be reviewed at: http://jameslhollymd.com/Letters/pdfs/cms-quality-resource-and-utilization-report-qrur-data-for-2015-for-setma-final.pdf.
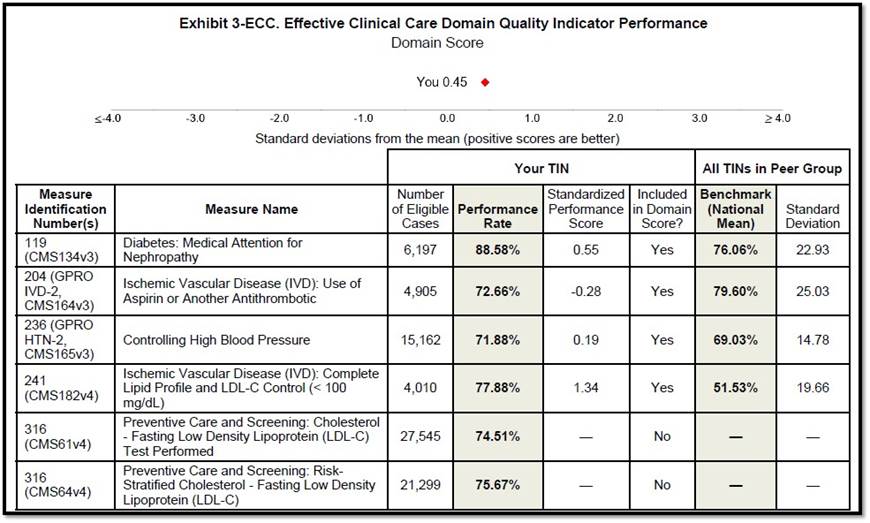
As can be seen in this data performance on the following quality indicators were very good except for one (in quality measures a positive standard deviation is good; a negative is below standards and above a 1.0 standard deviation places the group in the high quality performance quadrant).
- Diabetes Medical Attention for Nephropathy, standard deviation positive 0.56. The mean was 76.6% and SETMA’s performance was 88.58%.
- Ischemic Vascular Disease (IVD) use of Aspirin or Another Antithrombotic, standard deviation was a negative 0.28. The mean was 79.60% and SETMA’s performance was 72.66%. This is the only element of this domain which was substandard for SETMA.
- Preventive Care and Screening Cholesterol Fasting Low Density Lipoprotein (LDL-C) Test Performed, standard deviation is a positive 1.34. The mean was 51.53% and SETMA’s performance was 77.88%.
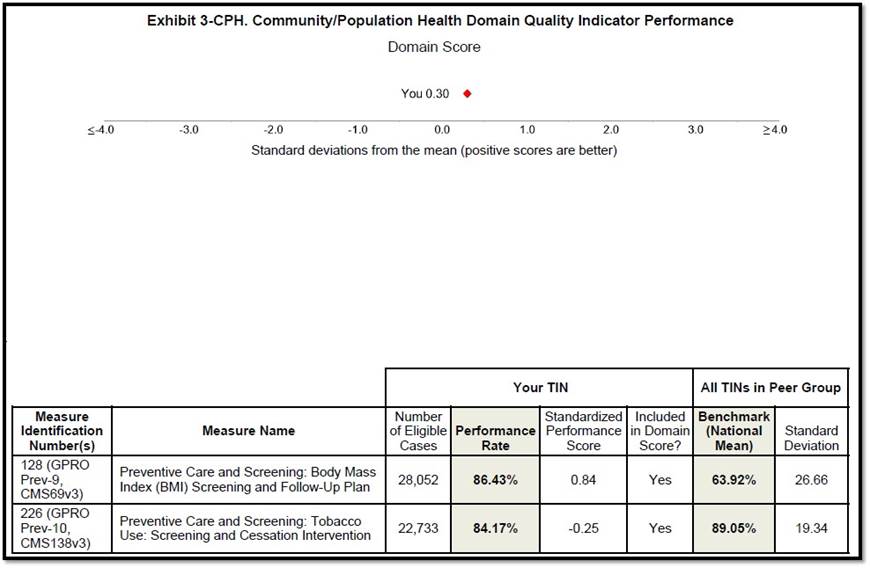
Community/Population Health Domain Quality Indicator Performance
The following is the composite score for the domain. SETMA’s composite score is 0.30 standard deviation above the mean, which is positive. However, it will be our intention to move this in 2017 to at least one standard deviation above the mean.
Patient Safety Doman Quality Indicator Performance
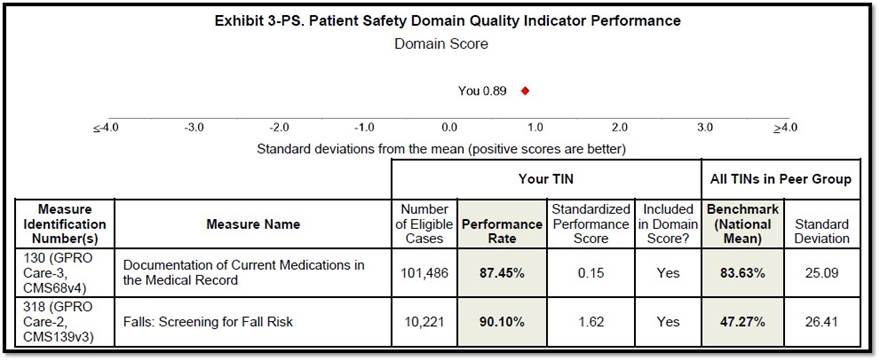
Two measures are included in this domain:
- Documentation of Current Medication in the Medical Record, standard deviation, positive 0.15. The mean is 83.63%; SETMA performance is 87.45%.
- Falls, Screening for Fall Risk, standard deviation positive 1.62. The mean is 47.27%, SETMA’s performance is 90.10%.
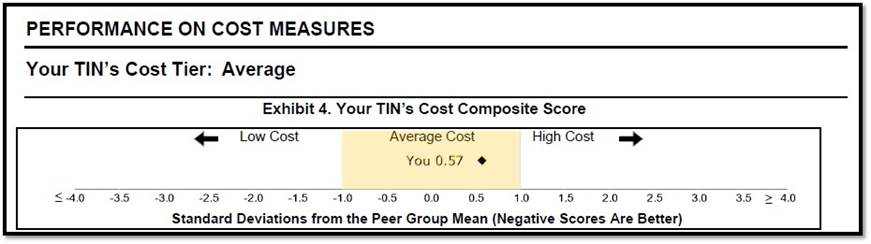
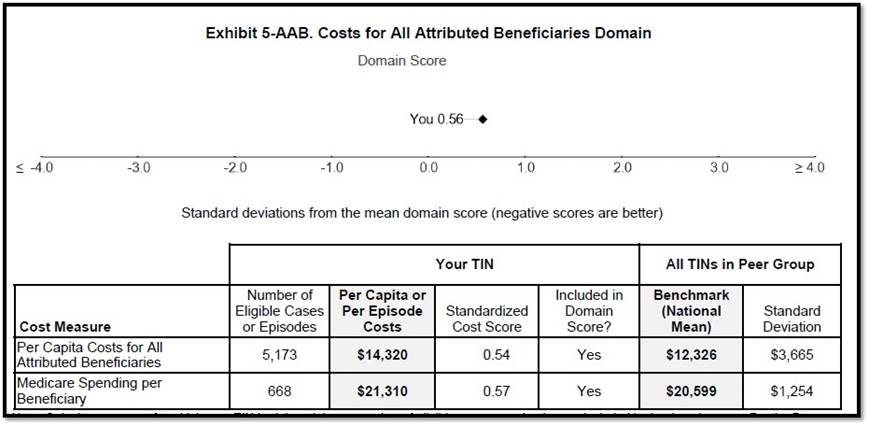
Performance on Cost Measures
SETMA’s cost for treating Medicare Fee-for-Service beneficiaries remains above the mean but still within one standard deviation. We have instituted steps to decrease our rate of admissions and to look at cost outliers which may be able to move us toward the mean on cost.
|