|
The Requirements of the Medicare Access and CHIP Reauthorization Act of 2015 (MACRA) which is the basisfor the Merit-Based Incentive
Payment System (MIPS) SETMA’s Analysis of and Preparation for MIPS And CMS’s Assessment of SETMA’s Past Performance
- A Brief Overview of the MIPS: Scoring System - Effective for 2019 Payments Based on 2017 Provider Performance
- A Detailed Review of MACRA and MIPS
- SETMA’s Medicare Fee-for-service Results of CMS Quality Resource Utilization Report (QRUR) for the First Half of 2015
MACRA and MIPS: An Analysis of the Final QRUR for the Full Year 2015
The second document under number three is the finalized 2015 Quality Resource and Utilization Report (QRUR) for SETMA. This was released September 27, 2016. In 2014 our Quality Composite Score was 0.18 and increased to 0.30 for 2015. This represents an increase in our quality performance. We have designed a tool described below which should enable us to improve this score significantly. Our goal is to at least exceed one deviation above the mean.
In 2014 our Cost Composite Score was 0.47 and increased to 0.57 for 2015. This represents a deterioration in our cost performance. We have designed tools for helping us decrease our rate of admissions which should improve our overall coast performance in 2017. Our goal is to get at least down to the mean on cost.
We still fall within the “Average Cost” and “Average Quality” categories which means we will see no change in our Medicare reimbursement in 2017.
In the following material there is additional analysis of how we can improve our performance and description of two new tools which will support that improvement:
- This link is to SETMA’s tutorial for how to refer patients to our outpatient infusion clinic because we have close to 2,000 long-term residential care patients, many get sent to the hospital for urinary tract infections, bacterial pneumonia and dehydration making our rate of admission and ultimately our cost for these conditions to be higher than the benchmark. The infusion center can help us decrease those admissions
- The following link is to SETMA’s tutorial for SETMA’s Merit-Based Incentive Payment System (MIPS) Quality Metric Tool Tutorial. This tutorial. The function described in this tutorial will allow SETMA’s providers to efficiently meet the metric standards. SETMA’s performance as seen in the 2015 Final GRUR above is very good but our goal is for all metrics to be at least above one standard deviation from the mean.
- SETMA’s Prescient Preparation for MACRA and MIPS As Of September, 2016
Four Categories of MIPS’s Scoring System
An Analysis of SETMA’s QRUR report for the first half of 2015 (link number three above) gives us direction for how to improve our performance in 2017. 2916 data will be analyzed by CMS in 2018 to determine healthcare providers “Composite Performance Score” (CPS). The analysis of our QRUR report shows SETMA’s performance on the four categories (Quality, Cost/Resources Utilization, Advancing Care Information -- MU, Clinical Practice Improvement Activities -- PC-MH) of the MIPS Scoring System are:
- Quality, represents 50% of the MIPS “Composite Performance Score,” quality is the residual of the PQRI and PQRS programs:
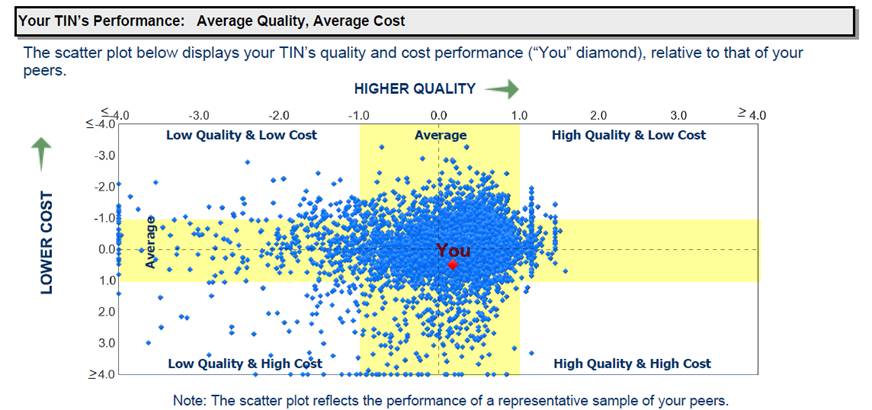
SETMA’s Performance is shown on a “scatter plot” which reflects that for 2014 we had average quality and average cost
Quality Also is Reflected by Outcomes Measures in SETMA’s QRUR’s “Calculated Quality Outcome Measure Performance.” SETMA is shown to have a high rate of admissions per thousand patients in three categories: bacterial pneumonia, urinary tract infection, dehydration. The following addresses why we think this is the case for SETMA and the steps of action, we will take to improve our performance. The major cause of this result is that SETMA treats almost 1700 patients in long-term-residential-care where these diagnoses are frequent.
- Cost/Resources Utilization - Cost/Resource Utilization contributes 10% to the MIPS Score -- SETMA’s Resources Utilization high in Emergency Room Utilization and in Post-Acute Care
What is Post Acute Care?
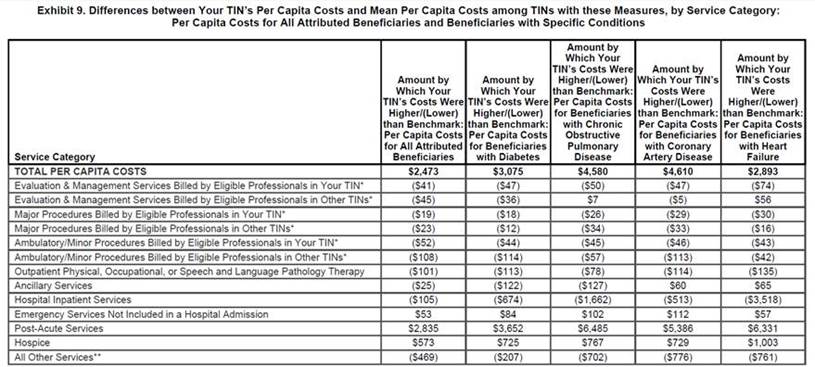
The below Exhibit from SETMA’s QRUR shows that in ten categories our cost is below the benchmark which is considered positive and in four categories it is high. However, it is never however than .48 of a standard deviation and it is never high in a category which would reflect that resources are being used for the financial advantage of the healthcare providers. SETMA has put into place processes for improving resource utilization in the ER and in Post-Acute Care.

- Advanced Care Information - category of the MIPS’ Scoring System is based on electronic patient records and reflects the values and functions of the standards previously known as Meaningful Use. This category is valued at 25% of the MIPS Score. SETMA meets all of the parts of this category of MIPS’s Scoring.
- Clinic Practice Improvement Activities - this category is valued at 15% and is fully met by a practice being recognized by NCQA as a Tier 3 Medical Home. SETMA’s PC-MH recognition by NCQA has been the highest from 2010-2019.
Summary by standard deviation for quality and cost and by scatter plot and MIPS assessment of payment for 2014 data


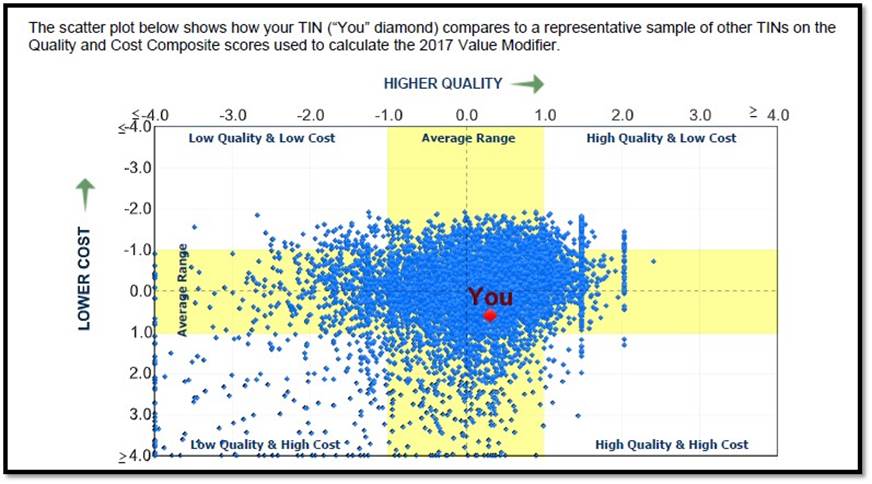
The following is the scatter plot for SETMA’s Performance for the full year of 2015. This is the data which will be used to calculate our Quality and Cost Composite Scores for payment in 2017. Year over year between 2014 and 2015, SETMA’s quality went from 0.18 standard deviation above the mean to a 0.30 standard deviation above the mean. In quality measurement, the higher the positive number, the better. Our goal as previously stated is to improve our quality measures to at least 1.0 standard deviation above the mean. This will place SETMA in the high quality range.
Between 2014 and 2015, SETMA’s cost went from 0.48 standard deviation above the mean in 2014 to 0.57 standard deviation above the mean for cost. Relative to cost, positive scores reflect a higher cost than a negative score. For 2017, SETMA’s goal is to move our cost to the mean or slightly below it.


|